Fashion conglomerate Oxford Industries (NYSE: OXM) met Wall Street’s revenue expectations in Q2 CY2026, but sales fell by 2.2% year on year to $394.4 million. On the other hand, next quarter’s revenue guidance of $290 million was less impressive, coming in 7.5% below analysts’ estimates. Its non-GAAP profit of $1.34 per share was 2.2% above analysts’ consensus estimates.
Is now the time to buy Oxford Industries? Find out by accessing our full research report, it’s free.
Oxford Industries (OXM) Q2 CY2026 Highlights:
- Revenue: $394.4 million vs analyst estimates of $394.6 million (2.2% year-on-year decline, in line)
- Adjusted EPS: $1.34 vs analyst estimates of $1.31 (2.2% beat)
- Adjusted EBITDA: $86 million vs analyst estimates of $44.1 million (21.8% margin, 95% beat)
- The company dropped its revenue guidance for the full year to $1.45 billion at the midpoint from $1.49 billion, a 2.7% decrease
- Management lowered its full-year Adjusted EPS guidance to $1.80 at the midpoint, a 28% decrease
- Operating Margin: 17.4%, up from 6.3% in the same quarter last year
- Free Cash Flow Margin: 20.4%, up from 13% in the same quarter last year
- Market Capitalization: $563.5 million
Mr. Chubb concluded, “Tommy Bahama’s positive momentum is being offset by softness in other parts of our portfolio, particularly Lilly Pulitzer which we believe is primarily attributable to addressable product and marketing challenges in a fashion merchandising business. The combination of these internal headwinds and ongoing macro-economic consumer pressure has led us to lower our guidance for fiscal 2026. We have initiated actions to position the business for profitable growth next year, including increasing our promotional activity at Lilly Pulitzer in the coming months to spur demand and prevent the build up of slow moving inventory. We’ve also implemented a broader review across the enterprise to identify opportunities aimed at enhancing our long-term earnings power that is less dependent on historical top-line growth rates.”
Company Overview
The parent company of Tommy Bahama, Oxford Industries (NYSE: OXM) is a lifestyle fashion conglomerate with brands that embody outdoor happiness.
Revenue Growth
Examining a company’s long-term performance can provide clues about its quality. Any business can put up a good quarter or two, but many enduring ones grow for years. Regrettably, Oxford Industries’s sales grew at a weak 8.2% compounded annual growth rate over the last five years. This was below our standard for the consumer discretionary sector and is a tough starting point for our analysis.
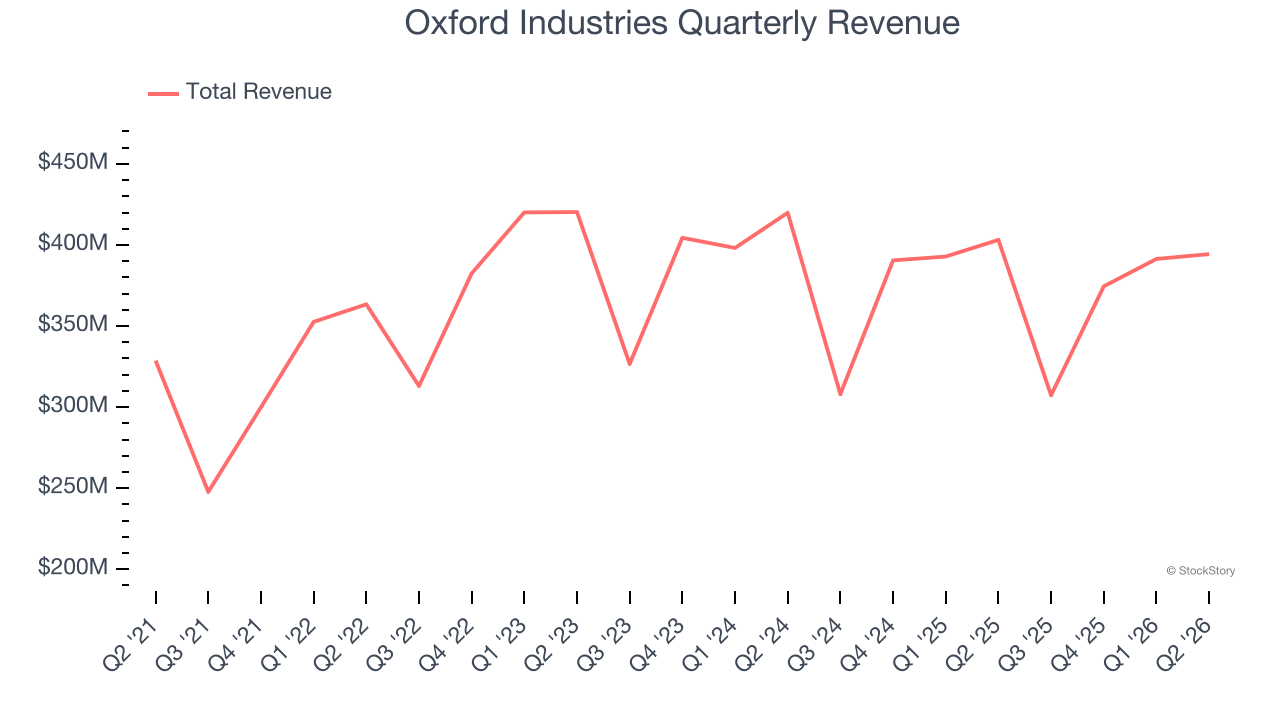
Long-term growth is the most important, but within consumer discretionary, product cycles are short and revenue can be hit-driven due to rapidly changing trends and consumer preferences. Oxford Industries’s performance shows it grew in the past but relinquished its gains over the last two years, as its revenue fell by 2.7% annually. 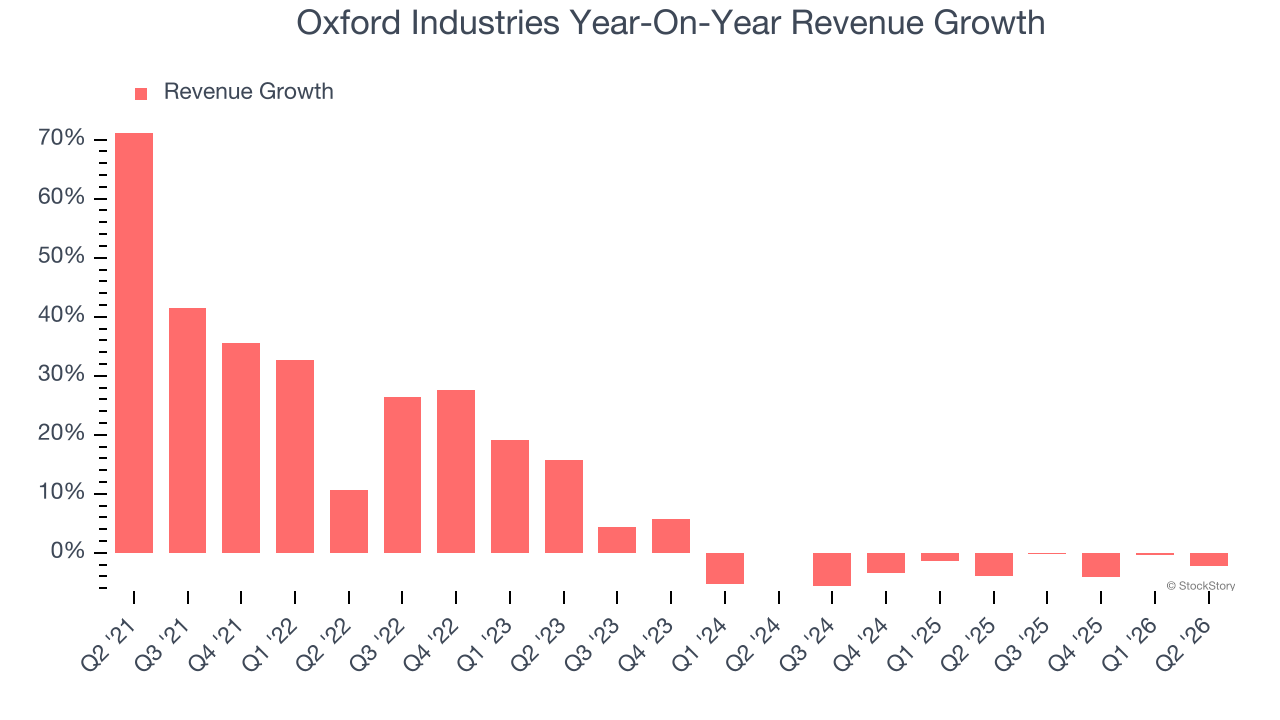
This quarter, Oxford Industries reported a rather uninspiring 2.2% year-on-year revenue decline to $394.4 million of revenue, in line with Wall Street’s estimates. Company management is currently guiding for a 5.6% year-on-year decline in sales next quarter.
Looking further ahead, sell-side analysts expect revenue to grow 3% over the next 12 months. Although this projection implies its newer products and services will fuel better top-line performance, it is still below the sector average.
WHILE YOU’RE HERE: The Next Palantir? One satellite company captures images of every point on Earth. Every single day. The Pentagon wants it. Hedge funds are using it to beat earnings. You’ve probably never heard of it.
This is what the early days of Palantir looked like before it became a giant. Same playbook. Different technology. If you missed Palantir, you need to see this. Claim The Stock Ticker for Free HERE.
Operating Margin
Operating margin is an important measure of profitability as it shows the portion of revenue left after accounting for all core expenses — everything from the cost of goods sold to advertising and wages. It’s also useful for comparing profitability across companies with different levels of debt and tax rates because it excludes interest and taxes.
Oxford Industries’s operating margin has been trending down over the last 12 months and averaged 2.5% over the last two years. The company’s profitability was mediocre for a consumer discretionary business and shows it couldn’t pass its higher operating expenses onto its customers.
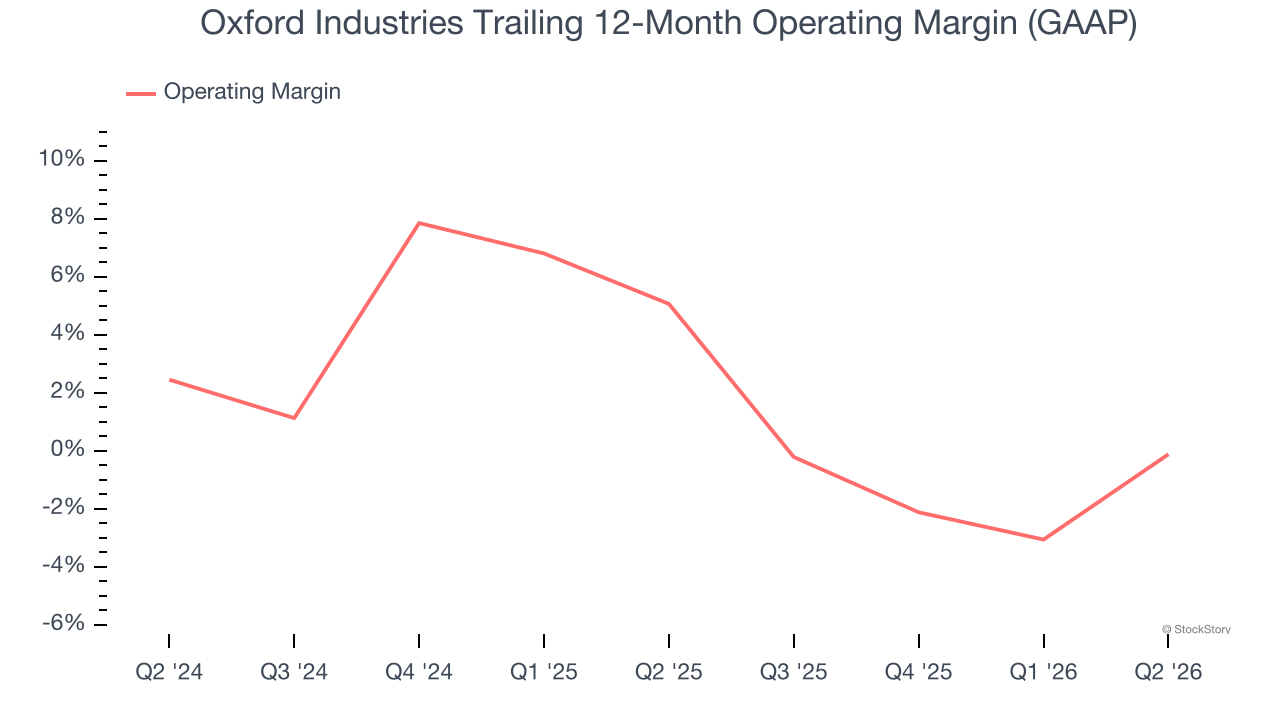
In Q2, Oxford Industries generated an operating margin profit margin of 17.4%, up 11.1 percentage points year on year. This increase was a welcome development, especially since its revenue fell, showing it was more efficient because it scaled down its expenses.
Earnings Per Share
Revenue trends explain a company’s historical growth, but the long-term change in earnings per share (EPS) points to the profitability of that growth — for example, a company could inflate its sales through excessive spending on advertising and promotions.
Sadly for Oxford Industries, its EPS declined by 18.6% annually over the last five years while its revenue grew by 8.2%. This tells us the company became less profitable on a per-share basis as it expanded due to non-fundamental factors such as interest expenses and taxes.
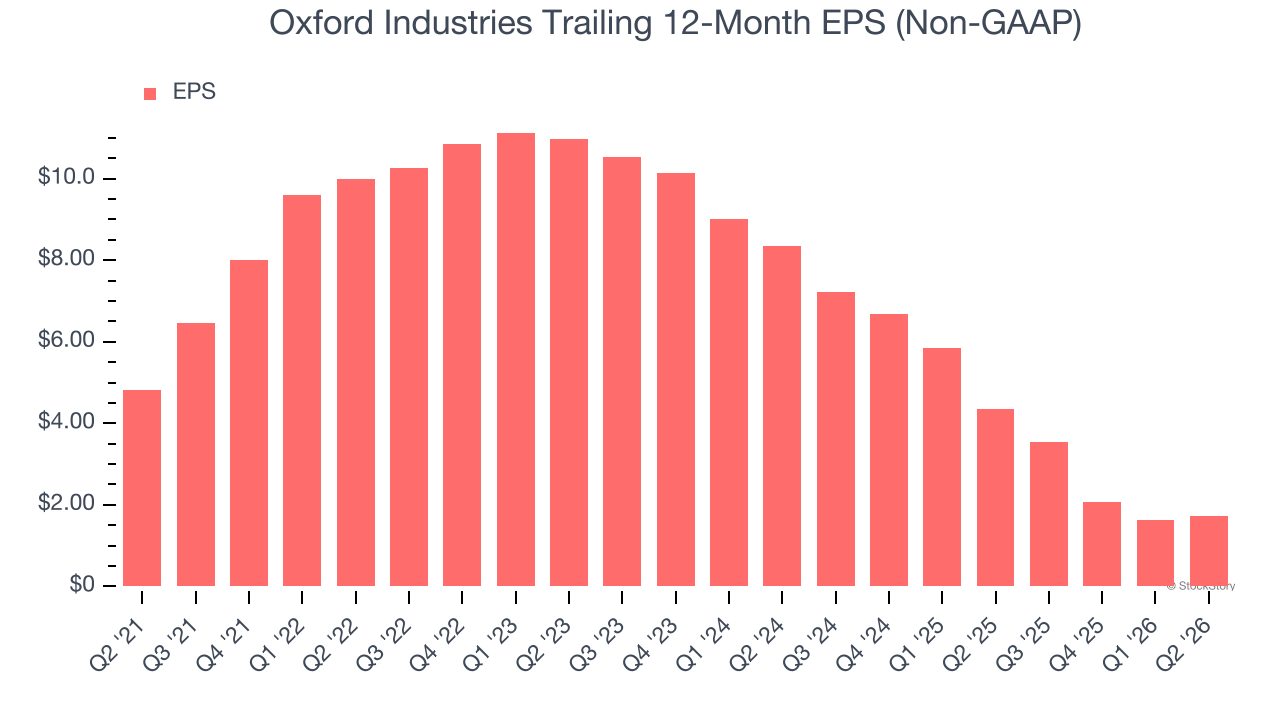
In Q2, Oxford Industries reported adjusted EPS of $1.34, up from $1.26 in the same quarter last year. This print beat analysts’ estimates by 2.2%. Over the next 12 months, Wall Street expects Oxford Industries’s full-year EPS to grow 75.6% from $1.72 to $3.02.
Key Takeaways from Oxford Industries’s Q2 Results
We were impressed by how significantly Oxford Industries blew past analysts’ EBITDA expectations this quarter. On the other hand, its full-year EPS guidance missed and its EPS guidance for next quarter fell short of Wall Street’s estimates. Overall, this was a weaker quarter. The stock traded down 15.8% to $30.79 immediately following the results.
The latest quarter from Oxford Industries’s wasn’t that good. One earnings report doesn’t define a company’s quality, though, so let’s explore whether the stock is a buy at the current price. What happened in the latest quarter matters, but not as much as longer-term business quality and valuation, when deciding whether to invest in this stock. We cover that in our actionable full research report which you can read here (it’s free).