Healthcare distributor Cencora (NYSE: COR) met Wall Street’s revenue expectations in calendar Q3 2026 (fiscal Q4 2026), with revenue up 5.5% year on year to $88.35 billion. Its non-GAAP profit of $4.66 per share was 1.9% above analysts’ consensus estimates.
For more on Cencora, read our full research report, available free.
Cencora (COR) Q3 CY2026 highlights:
- Revenue $88.35 billion vs S&P analysts’ consensus estimates of $88.28 billion (5.5% year-on-year growth, in line)
- Adjusted EPS $4.66 vs S&P analysts’ consensus estimates of $4.57 (1.9% beat)
- Adjusted EPS guidance $19.58 at the midpoint for fiscal 2027, missing analysts’ consensus estimates by 1%
- Operating margin 1%, up from 0% in the same quarter last year
- Free cash flow margin 3.1%, similar to the same quarter last year
- Market capitalization $64.98 billion
“Fiscal 2026 was a pivotal year for Cencora, as we expanded our MSO platform through the acquisition of OneOncology, sharpened the focus of our portfolio and delivered record results,” said Robert P. Mauch, President and Chief Executive Officer of Cencora. “These actions laid the foundation and position us to move forward with significant momentum and clear strategic priorities.”
Revenue growth
Reviewing a company’s long-term revenue performance reveals insights into its quality. Any business can have short-term success, but a high-quality one grows for years. Over the last five years, Cencora grew its revenue at a decent 9.5% compounded annual growth rate. Its growth was slightly above the average healthcare company and shows its offerings resonate with customers.
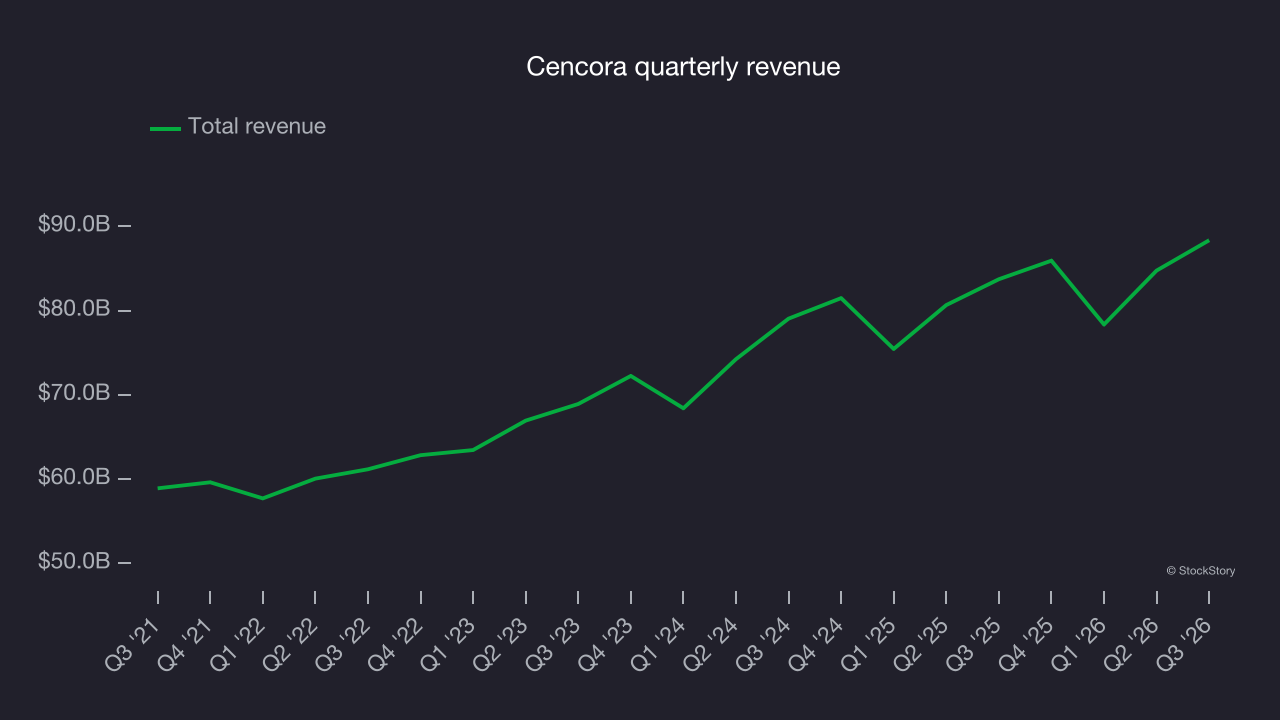
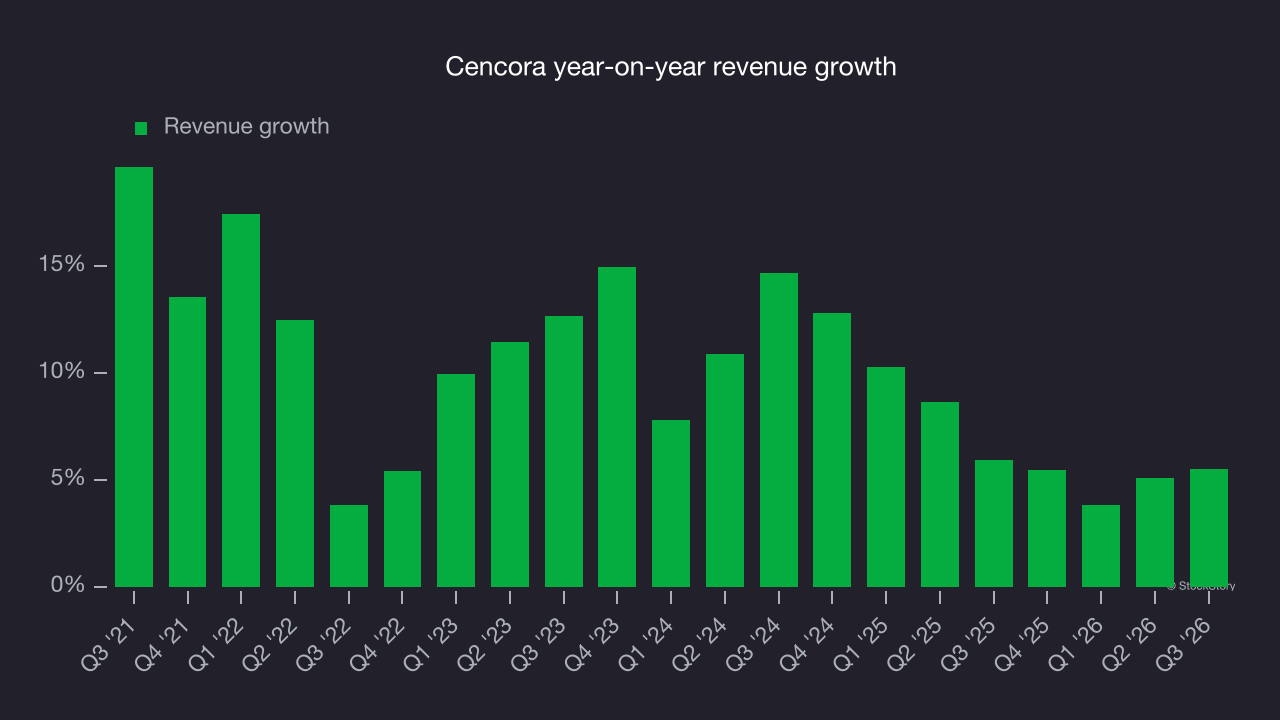
Long-term growth matters most, but within healthcare, a half-decade historical view may miss recent innovations or disruptive industry trends. Cencora’s recent performance shows its demand has slowed as its annualized revenue growth of 7.1% over the last two years was below its five-year trend. Decelerating revenue growth in the sector warrants caution, as it could signal changing consumer tastes aided by low switching costs.
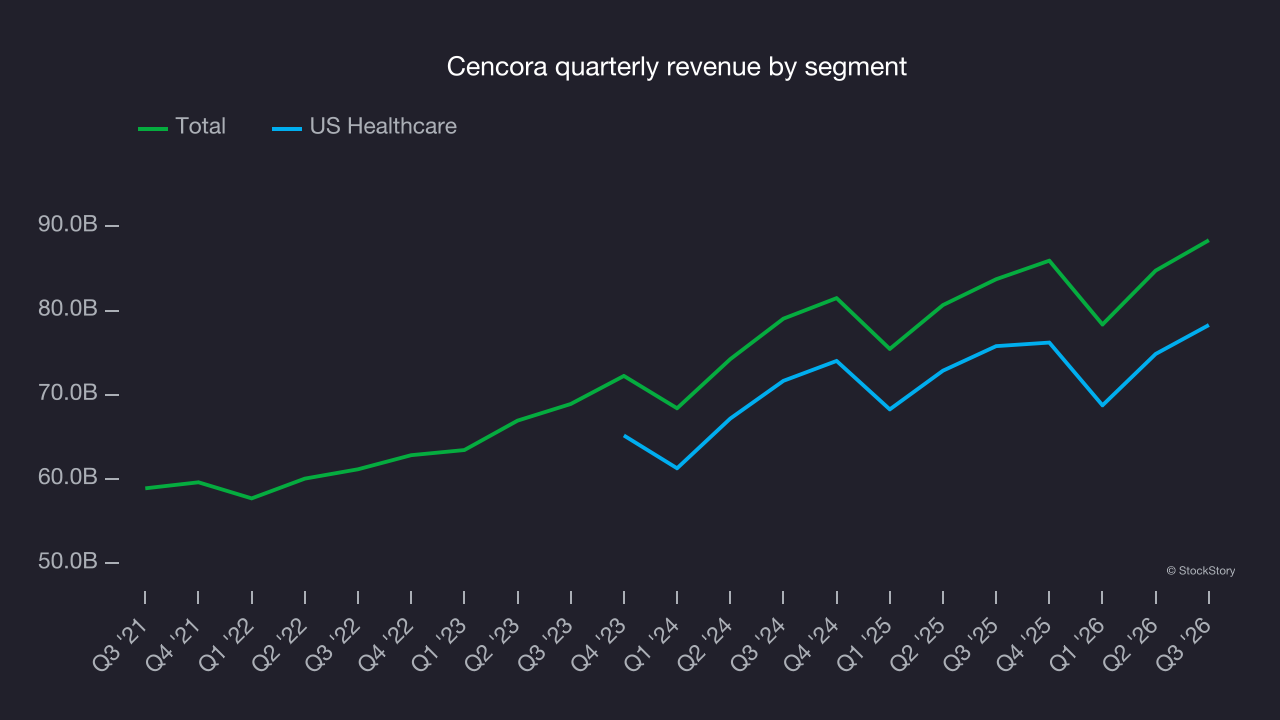
Cencora also breaks out the revenue for its most important segment, US Healthcare. Over the last two years, Cencora’s US Healthcare revenue averaged 6.1% year-on-year growth.
This quarter, Cencora grew its revenue by 5.5% year on year, and its $88.35 billion of revenue was in line with Wall Street’s consensus estimates.
Looking ahead, sell-side analysts expect revenue to grow 4.7% over the next 12 months, according to S&P, a slight deceleration versus the last two years. This uninspiring projection implies its products and services will see some demand headwinds. On the positive side, the company is tracking well in other measures of financial health.
Adjusted operating margin
Adjusted operating margin is a key measure of profitability. Think of it as net income (the bottom line) excluding the impact of non-recurring expenses, taxes and interest on debt – items less connected to business fundamentals.
Cencora’s adjusted operating margin has generally stayed the same over the last 12 months, averaging 1.3% over the last five years. This poor profitability for a healthcare business stemmed from its suboptimal cost structure.
Looking at the trend in its profitability, Cencora’s adjusted operating margin might have fluctuated slightly but has generally stayed the same over the last five years. This raises questions about the company’s expense base because its revenue growth should have given it leverage on its fixed costs, resulting in better economies of scale and profitability.
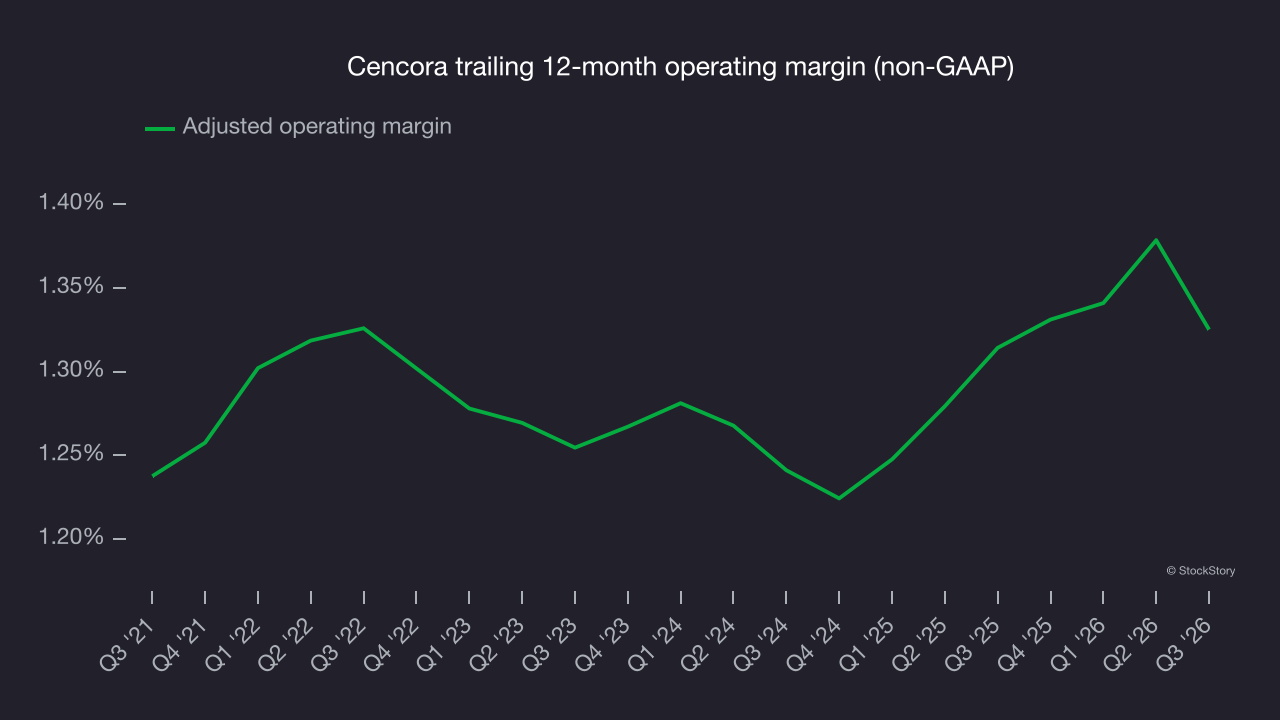
This quarter, Cencora generated an adjusted operating margin of 1%, in line with the same quarter last year. This indicates the company’s overall cost structure has been relatively stable.
Earnings per share
Long-term earnings per share, or EPS, growth matters for the same reason as long-term revenue growth. Compared to revenue, however, EPS highlights whether a company’s growth is profitable.
Cencora’s EPS grew at a 14.2% compounded annual growth rate over the last five years, higher than its 9.5% annualized revenue growth. However, this alone doesn’t tell us much about its business quality because its adjusted operating margin didn’t improve.
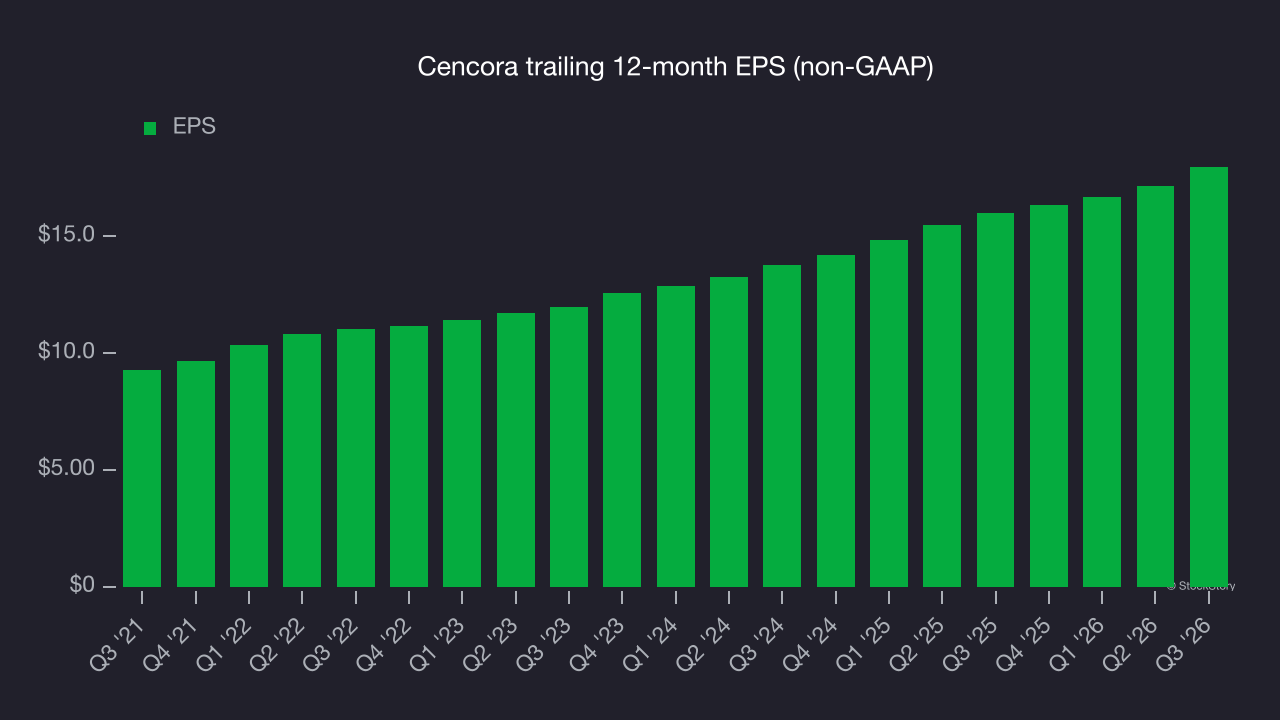
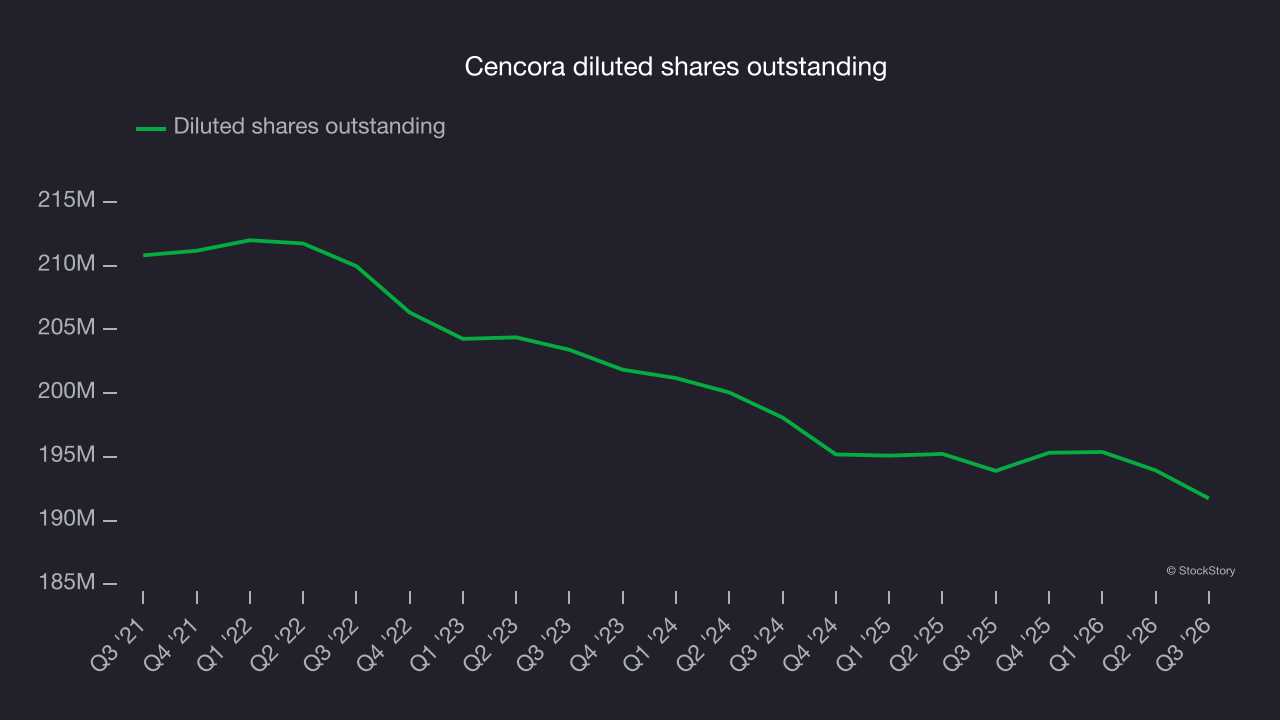
Diving into Cencora’s quality of earnings can give us a better understanding of its performance. A five-year view shows that Cencora has repurchased its stock, shrinking its share count by 9%. This tells us its EPS outperformed its revenue not because of increased operational efficiency but financial engineering, as buybacks boost per share earnings.
In Q3, Cencora reported adjusted EPS of $4.66, up from $3.84 in the same quarter last year. This result beat analysts’ consensus estimates by 1.9%. Over the next 12 months, Wall Street expects Cencora’s full-year EPS to grow 9.9% from $17.97 to $19.75, according to S&P.
Key takeaways from Cencora’s Q3 results
Cencora’s Q3 results was largely mixed with some key positives and negatives. Shares remained flat at $342.08 immediately after the release.
When deciding whether to invest in Cencora at its current price, the latest quarter matters, but not nearly as much as longer-term fundamentals and valuation. Read our full research report here for more on those factors (it’s free).