

IT infrastructure services provider Kyndryl (NYSE: KD) missed Wall Street’s revenue expectations in Q2 CY2026, with sales falling 3.3% year on year to $3.62 billion. Its non-GAAP loss of $0.12 per share was 29.4% above analysts’ consensus estimates.
Is now the time to buy Kyndryl? Find out by accessing our full research report, it’s free.
Kyndryl (KD) Q2 CY2026 Highlights:
- Revenue: $3.62 billion vs analyst estimates of $3.64 billion (3.3% year-on-year decline, 0.7% miss)
- Adjusted EPS: -$0.12 vs analyst estimates of -$0.17 (29.4% beat)
- Adjusted EBITDA: $512 million vs analyst estimates of $460.6 million (14.2% margin, 11.2% beat)
- Free Cash Flow was -$459 million compared to -$252.3 million in the same quarter last year
- Market Capitalization: $3.24 billion
"Our first quarter results reflected strong momentum in signings, supported by strength in Kyndryl Consult and hyperscalers, with an increasing demand for AI-led modernization solutions," said Chairman and Chief Executive Officer Martin Schroeter.
Company Overview
Born from IBM's managed infrastructure services business in a 2021 spinoff, Kyndryl (NYSE: KD) is the world's largest IT infrastructure services provider that designs, builds, and manages technology environments for enterprise customers.
Revenue Growth
Reviewing a company’s long-term sales performance reveals insights into its quality. Any business can put up a good quarter or two, but many enduring ones grow for years.
With $14.97 billion in revenue over the past 12 months, Kyndryl is a behemoth in the business services sector and benefits from economies of scale, giving it an edge in distribution. This also enables it to gain more leverage on its fixed costs than smaller competitors and the flexibility to offer lower prices. However, its scale is a double-edged sword because it’s harder to find incremental growth when you’ve penetrated most of the market. For Kyndryl to boost its sales, it likely needs to adjust its prices, launch new offerings, or lean into foreign markets.
As you can see below, Kyndryl struggled to generate demand over the last five years. Its sales dropped by 5% annually, a poor baseline for our analysis.
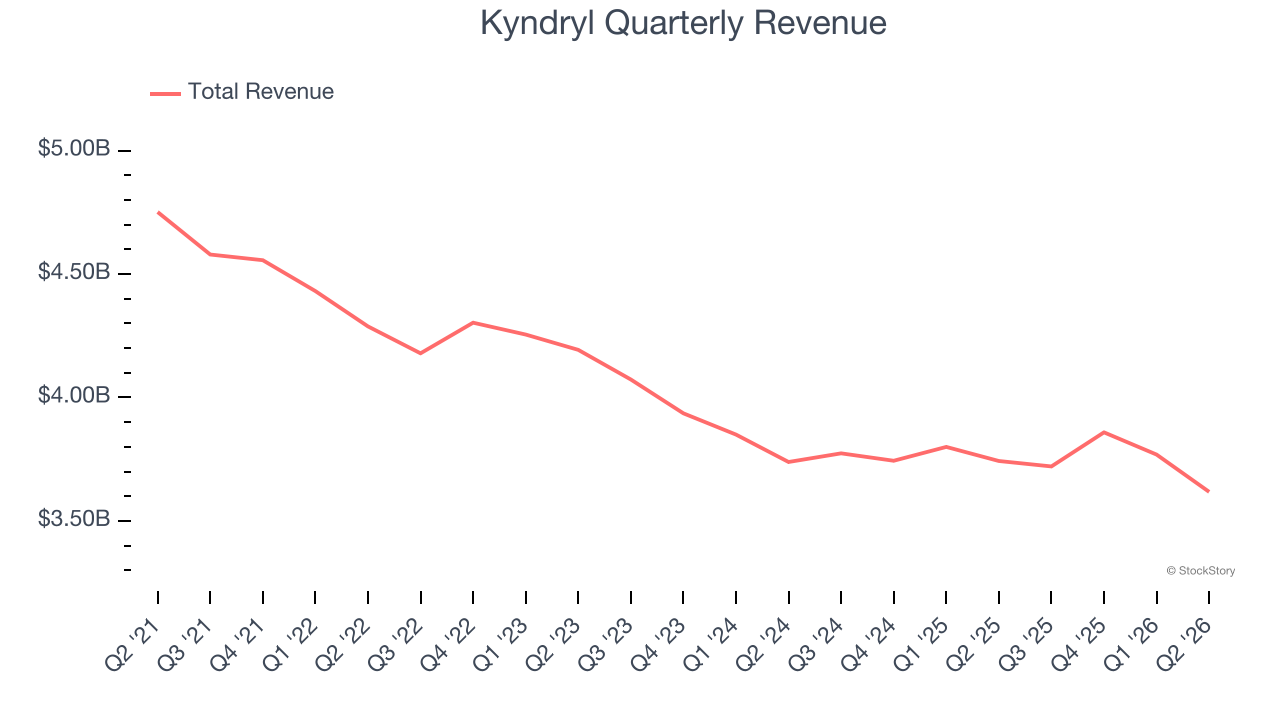
We at StockStory place the most emphasis on long-term growth, but within business services, a half-decade historical view may miss recent innovations or disruptive industry trends. Kyndryl’s annualized revenue declines of 2% over the last two years suggest its demand continued shrinking. 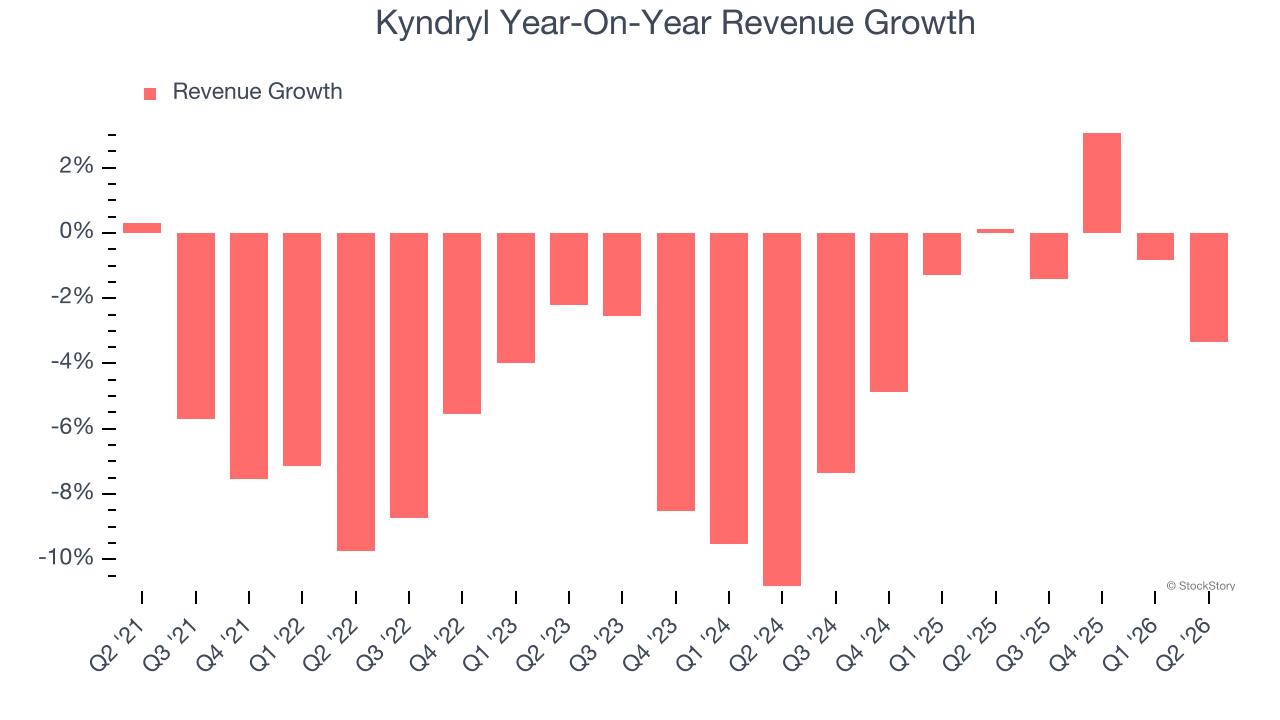
This quarter, Kyndryl missed Wall Street’s estimates and reported a rather uninspiring 3.3% year-on-year revenue decline, generating $3.62 billion of revenue.
Looking ahead, sell-side analysts expect revenue to remain flat over the next 12 months. Although this projection implies its newer products and services will catalyze better top-line performance, it is still below the sector average.
ONE MORE THING: The $21 AI Application Stock Wall Street Forgot. While Wall Street obsesses over who’s building AI, one company is already using it to print money. And nobody’s paying attention.
AI chip stocks trade at ridiculous valuations. This company processes a trillion consumer signals monthly using AI and trades at a third of the price. The gap won’t last. The institutions will figure it out. You need to see this first. Read the FREE Report Before They Notice.
Operating Margin
Operating margin is a key measure of profitability. Think of it as net income - the bottom line - excluding the impact of taxes and interest on debt, which are less connected to business fundamentals.
Kyndryl’s high expenses have contributed to an average operating margin of negative 1.2% over the last five years. Unprofitable business services companies require extra attention because they could get caught swimming naked when the tide goes out. It’s hard to trust that the business can endure a full cycle.
On the plus side, Kyndryl’s operating margin rose by 13.1 percentage points over the last five years. Still, it will take much more for the company to reach long-term profitability.
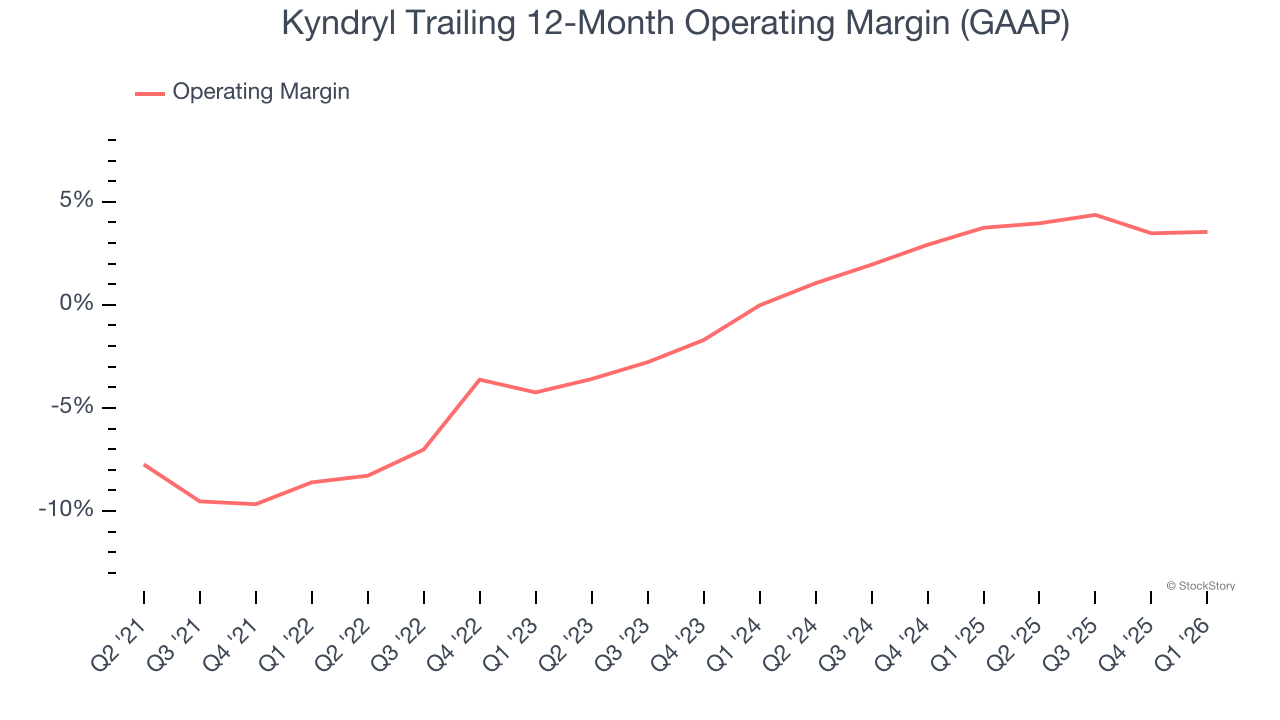
in line with the same quarter last year. This indicates the company’s overall cost structure has been relatively stable.
Earnings Per Share
We track the long-term change in earnings per share (EPS) for the same reason as long-term revenue growth. Compared to revenue, however, EPS highlights whether a company’s growth is profitable.
Kyndryl’s full-year EPS flipped from negative to positive over the last four years. This is encouraging and shows it’s at a critical moment in its life.
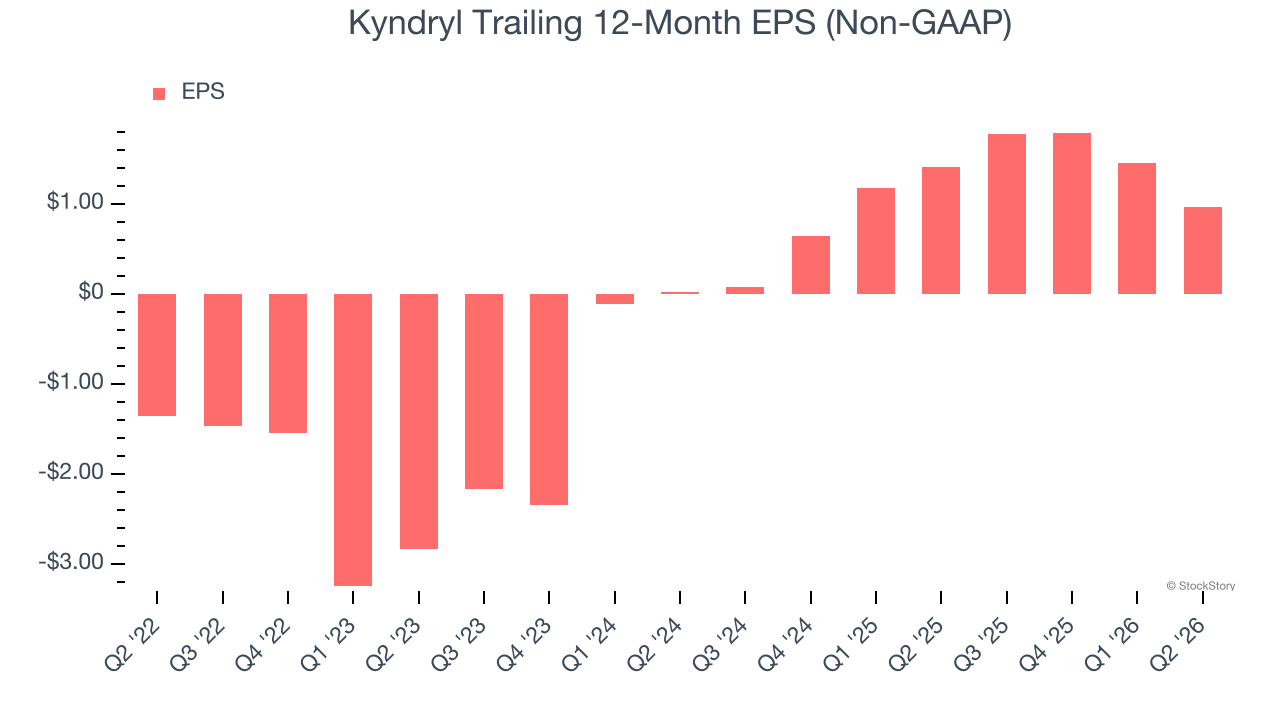
Like with revenue, we analyze EPS over a shorter period to see if we are missing a change in the business.
Kyndryl’s EPS grew at an astounding 593% compounded annual growth rate over the last two years, higher than its 2% annualized revenue declines. This tells us management adapted its cost structure in response to a challenging demand environment.
We can take a deeper look into Kyndryl’s earnings quality to better understand the drivers of its performance. A two-year view shows that Kyndryl has repurchased its stock, shrinking its share count by 6.4%. This tells us its EPS outperformed its revenue not because of increased operational efficiency but financial engineering, as buybacks boost per share earnings. 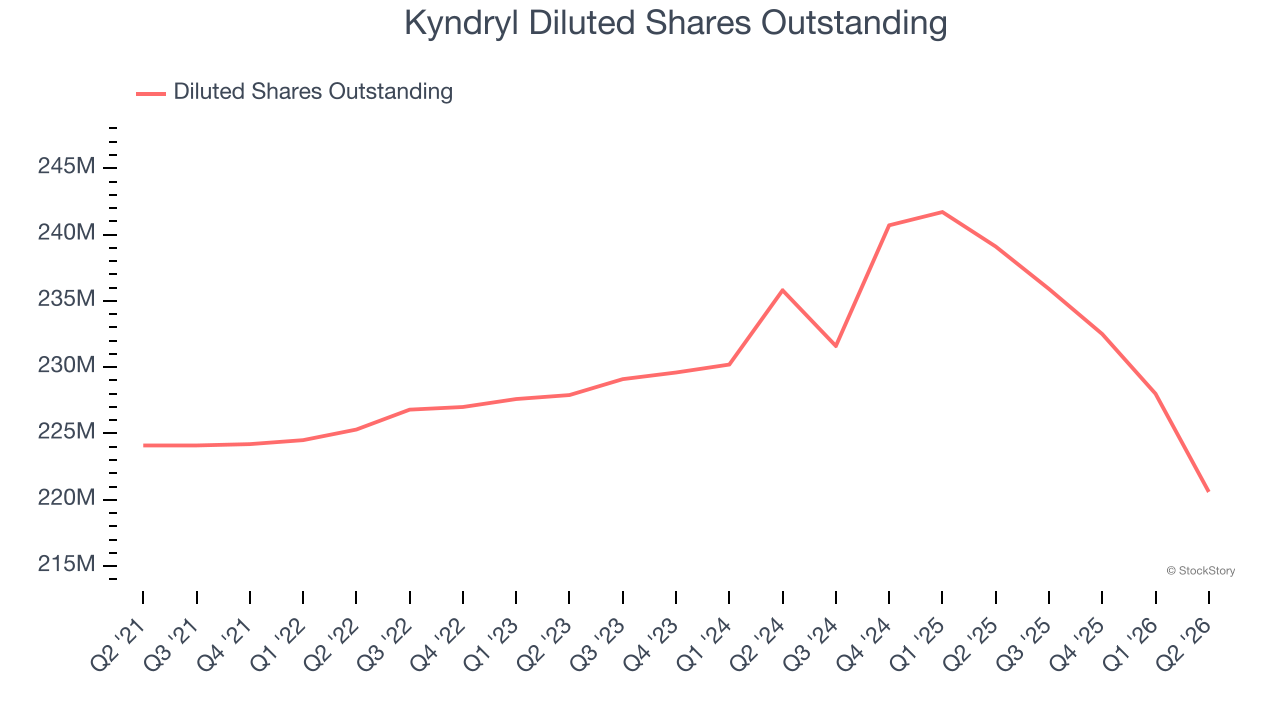
In Q2, Kyndryl reported adjusted EPS of negative $0.12, down from $0.37 in the same quarter last year. Despite falling year on year, this print easily cleared analysts’ estimates. Over the next 12 months, Wall Street expects Kyndryl’s full-year EPS to grow 161% from $0.96 to $2.51.
Key Takeaways from Kyndryl’s Q2 Results
It was good to see Kyndryl beat analysts’ EPS expectations this quarter. On the other hand, its revenue slightly missed. Overall, we think this was a decent quarter with some key metrics above expectations. Investors were likely hoping for more, and shares traded down 2% to $14.27 immediately following the results.
Is Kyndryl an attractive investment opportunity right now? The latest quarter does matter, but not nearly as much as longer-term fundamentals and valuation, when deciding if the stock is a buy. We cover that in our actionable full research report which you can read here (it’s free).