
Cloud observability platform Dynatrace (NYSE: DT) beat Wall Street’s revenue expectations in Q2 CY2026, with sales up 16.2% year on year to $554.5 million. The company expects next quarter’s revenue to be around $567.5 million, close to analysts’ estimates. Its non-GAAP profit of $0.48 per share was 8.2% above analysts’ consensus estimates.
Is now the time to buy Dynatrace? Find out by accessing our full research report, it’s free.
Dynatrace (DT) Q2 CY2026 Highlights:
- Revenue: $554.5 million vs analyst estimates of $549.7 million (16.2% year-on-year growth, 0.9% beat)
- Adjusted EPS: $0.48 vs analyst estimates of $0.44 (8.2% beat)
- Adjusted Operating Income: $161.6 million vs analyst estimates of $153 million (29.1% margin, 5.7% beat)
- The company dropped its revenue guidance for the full year to $2.31 billion at the midpoint from $2.33 billion, a 0.6% decrease
- Management raised its full-year Adjusted EPS guidance to $1.98 at the midpoint, a 2.1% increase
- Operating Margin: 12.9%, in line with the same quarter last year
- Free Cash Flow Margin: 55.8%, up from 39.9% in the previous quarter
- Annual Recurring Revenue: $2.14 billion vs analyst estimates of $2.13 billion (17.2% year-on-year growth, in line)
- Billings: $417.8 million at quarter end, up 7.6% year on year
- Market Capitalization: $13.27 billion
Company Overview
With its platform processing over 30 trillion pieces of IT performance data daily, Dynatrace (NYSE: DT) provides an AI-powered platform that helps organizations monitor, secure, and optimize their applications and IT infrastructure across cloud environments.
Revenue Growth
A company’s long-term sales performance can indicate its overall quality. Any business can experience short-term success, but top-performing ones enjoy sustained growth for years. Over the last five years, Dynatrace grew its sales at a solid 22.6% compounded annual growth rate. Its growth beat the average software company and shows its offerings resonate with customers, a helpful starting point for our analysis.
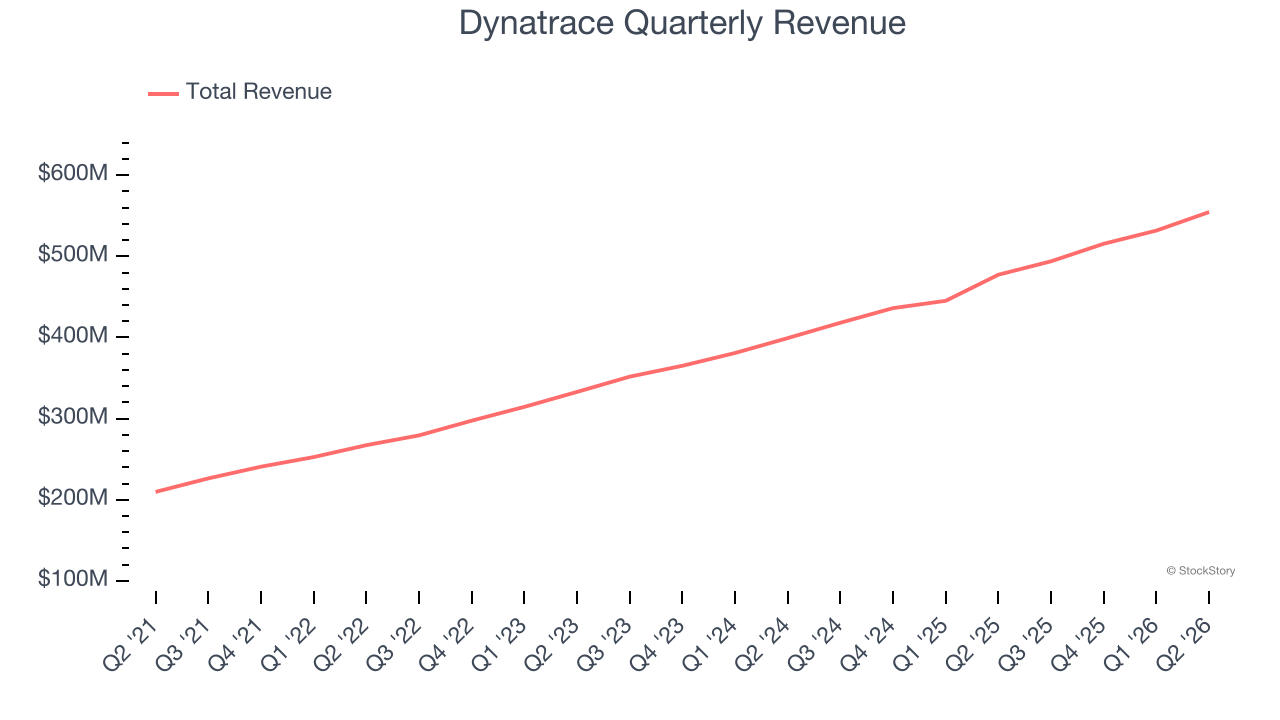
We at StockStory place the most emphasis on long-term growth, but within software, a half-decade historical view may miss recent innovations or disruptive industry trends. Dynatrace’s annualized revenue growth of 18.3% over the last two years is below its five-year trend, but we still think the results suggest healthy demand. 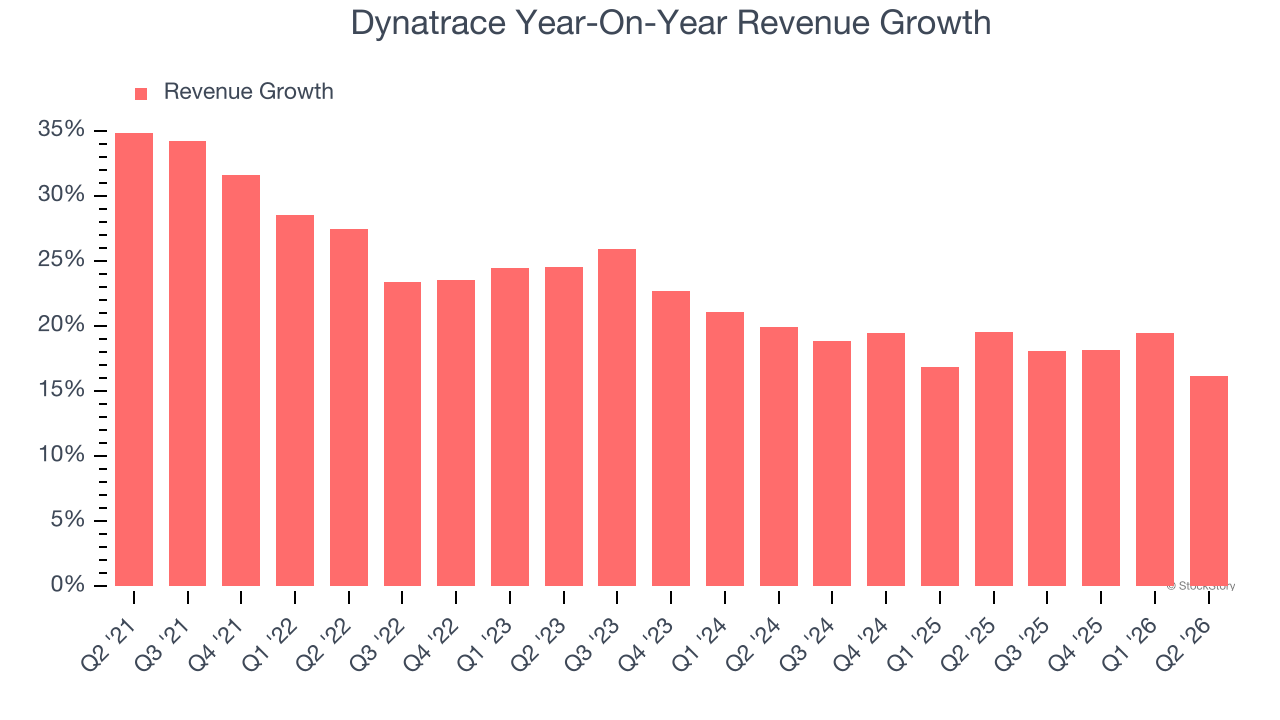
This quarter, Dynatrace reported year-on-year revenue growth of 16.2%, and its $554.5 million of revenue exceeded Wall Street’s estimates by 0.9%. Company management is currently guiding for a 14.9% year-on-year increase in sales next quarter.
Looking further ahead, sell-side analysts expect revenue to grow 15.1% over the next 12 months, a deceleration versus the last two years. Still, this projection is above average for the sector and indicates the market is baking in some success for its newer products and services.
ALSO WORTH WATCHING: Nvidia’s Quiet Partner. Nvidia’s chips cost a hundred grand. The connectors that make them work cost even more. One company makes them all.
Every AI server needs specialized infrastructure the chip companies don’t make. High-speed cables. Power connectors. Thermal sensors. This 90-year-old company built a monopoly on it. The AI boom just started. This stock is still flying under the radar. Claim The Stock Ticker Here for FREE.
Annual Recurring Revenue
While reported revenue for a software company can include low-margin items like implementation fees, annual recurring revenue (ARR) is a sum of the next 12 months of contracted revenue purely from software subscriptions, or the high-margin, predictable revenue streams that make SaaS businesses so valuable.
Dynatrace’s ARR punched in at $2.14 billion in Q2, and over the last four quarters, its growth was solid as it averaged 18.2% year-on-year increases. This performance aligned with its total sales growth, reflecting the company’s ability to maintain strong customer relationships and secure longer-term commitments. Its growth also contributes positively to Dynatrace’s predictability and valuation, as investors typically prefer businesses with recurring revenue. 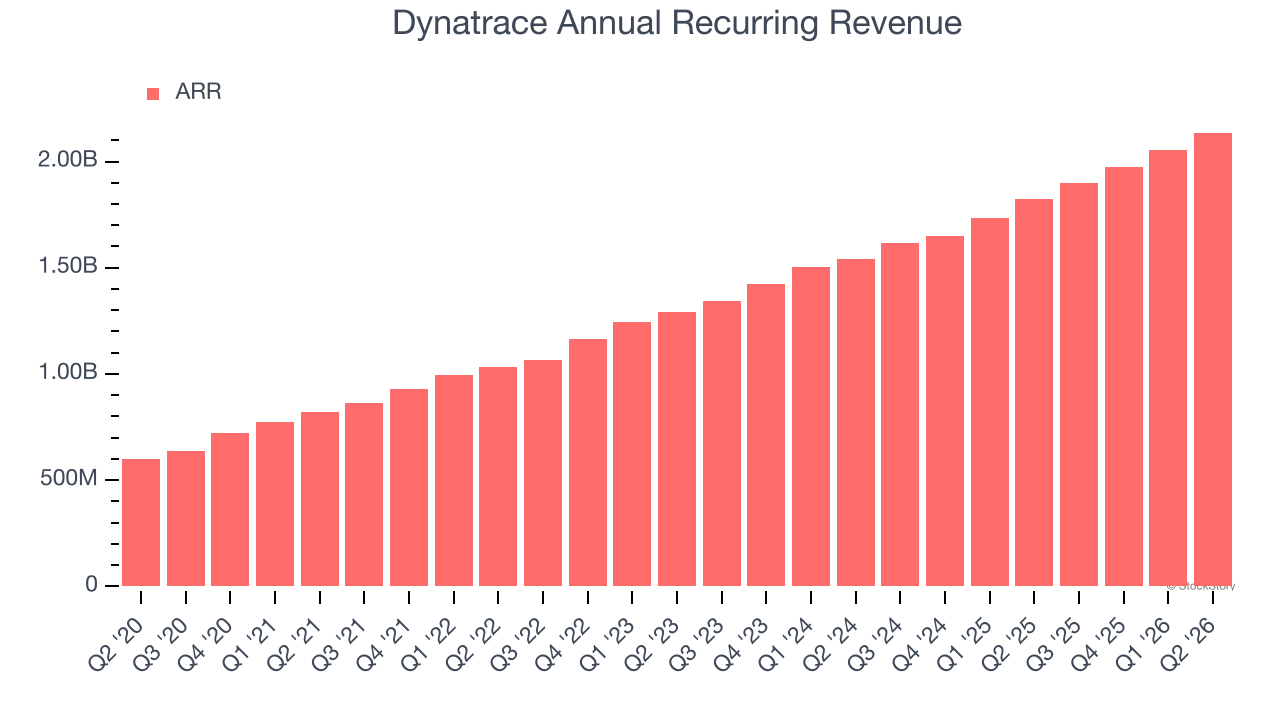
Customer Acquisition Efficiency
The customer acquisition cost (CAC) payback period measures the months a company needs to recoup the money spent on acquiring a new customer. This metric helps assess how quickly a business can break even on its sales and marketing investments.
Dynatrace is quite efficient at acquiring new customers, and its CAC payback period checked in at 33.6 months this quarter. The company’s rapid recovery of its customer acquisition costs indicates it has a strong brand reputation, giving it more resources pursue new product initiatives while maintaining the flexibility to increase its sales and marketing investments. 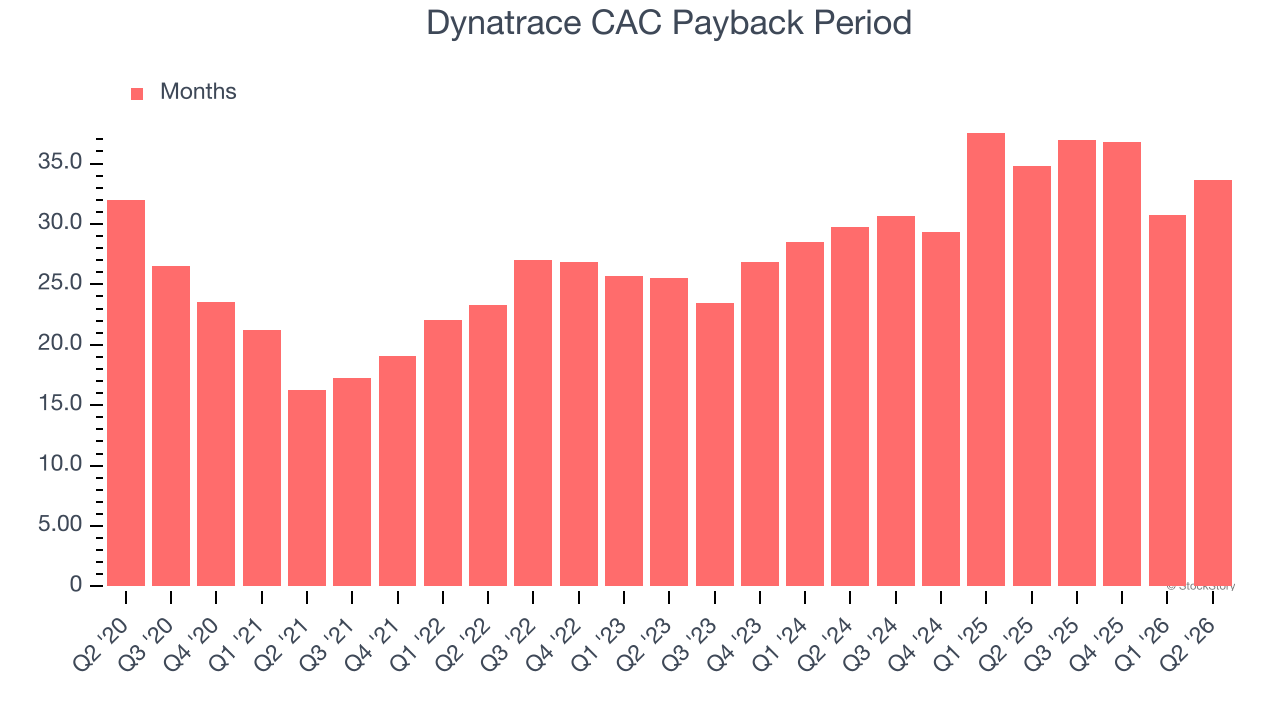
Key Takeaways from Dynatrace’s Q2 Results
We enjoyed seeing Dynatrace beat analysts’ adjusted operating income expectations this quarter. We were also glad its full-year EPS guidance exceeded Wall Street’s estimates. On the other hand, its billings missed and its full-year revenue guidance fell slightly short of Wall Street’s estimates. Overall, this quarter was mixed. The stock traded up 10.3% to $50.44 immediately following the results.
Should you buy the stock or not? What happened in the latest quarter matters, but not as much as longer-term business quality and valuation, when deciding whether to invest in this stock. We cover that in our actionable full research report which you can read here (it’s free).