

Clothing company Kontoor Brands (NYSE: KTB) met Wall Street’s revenue expectations in Q2 CY2026, with sales up 18.5% year on year to $584 million. On the other hand, the company’s full-year revenue guidance of $2.69 billion at the midpoint came in 0.6% below analysts’ estimates. Its non-GAAP profit of $1.06 per share was 2.1% above analysts’ consensus estimates.
Is now the time to buy Kontoor Brands? Find out by accessing our full research report, it’s free.
Kontoor Brands (KTB) Q2 CY2026 Highlights:
- Revenue: $584 million vs analyst estimates of $584.8 million (18.5% year-on-year growth, in line)
- Adjusted EPS: $1.06 vs analyst estimates of $1.04 (2.1% beat)
- Adjusted EBITDA: $103.1 million vs analyst estimates of $106.4 million (17.7% margin, 3.1% miss)
- The company dropped its revenue guidance for the full year to $2.69 billion at the midpoint from $3.44 billion, a 21.8% decrease
- Management lowered its full-year Adjusted EPS guidance to $5.30 at the midpoint, a 20.3% decrease
- Operating Margin: 15.5%, in line with the same quarter last year
- Free Cash Flow Margin: 7.2%, up from 4.5% in the same quarter last year
- Constant Currency Revenue rose 18% year on year (8% in the same quarter last year)
- Market Capitalization: $4.14 billion
Company Overview
Founded in 2019 after separating from VF Corporation, Kontoor Brands (NYSE: KTB) is a clothing company known for its high-quality denim products.
Revenue Growth
A company’s long-term sales performance can indicate its overall quality. Any business can experience short-term success, but top-performing ones enjoy sustained growth for years. Over the last five years, Kontoor Brands grew its sales at a weak 2.4% compounded annual growth rate. This was below our standards and is a rough starting point for our analysis.
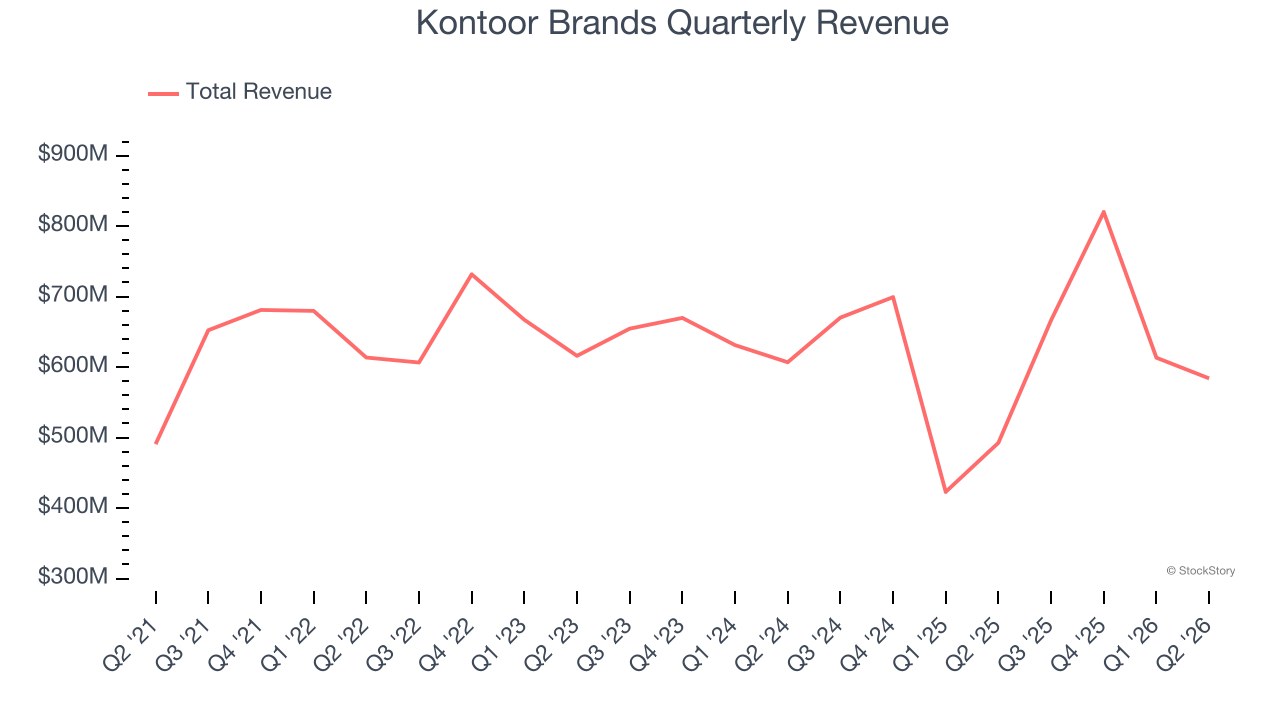
Long-term growth is the most important, but within consumer discretionary, product cycles are short and revenue can be hit-driven due to rapidly changing trends and consumer preferences. Kontoor Brands’s annualized revenue growth of 2.3% over the last two years aligns with its five-year trend, suggesting its demand was consistently weak. 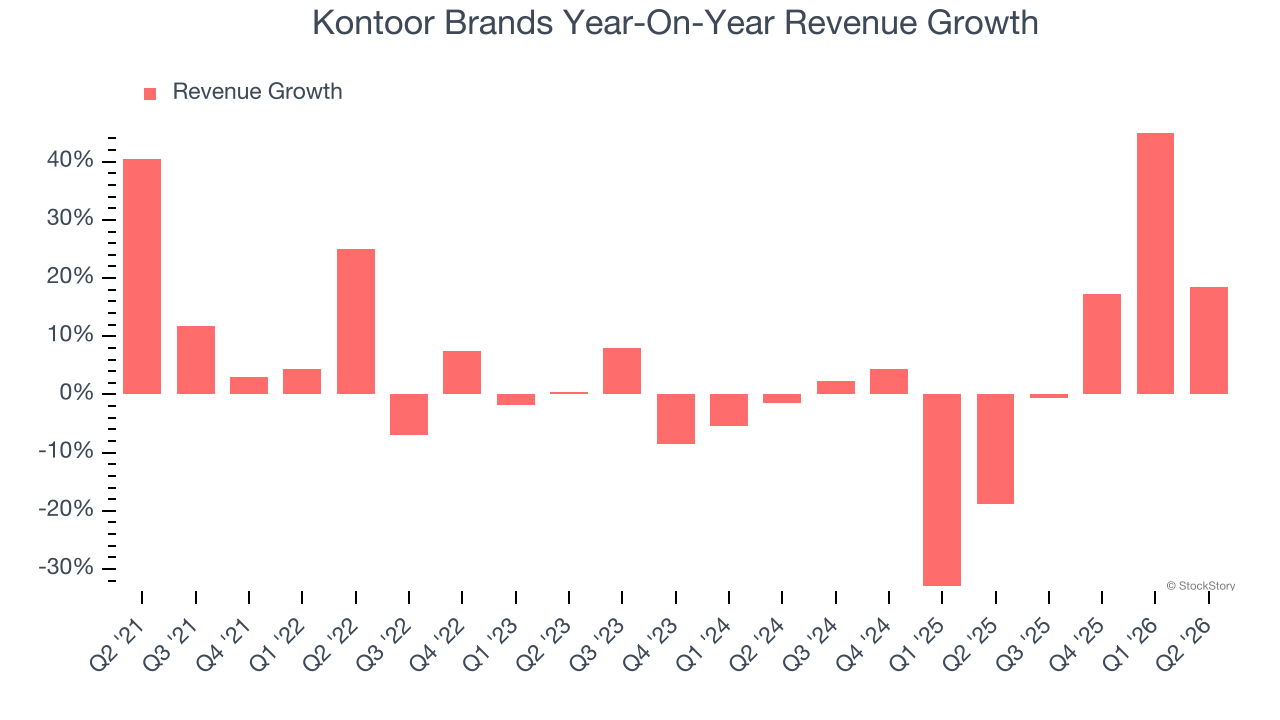
We can dig further into the company’s sales dynamics by analyzing its constant currency revenue, which excludes currency movements that are outside their control and not indicative of demand. Over the last two years, its constant currency sales averaged 17.9% year-on-year growth. Because this number is better than its normal revenue growth, we can see that foreign exchange rates have been a headwind for Kontoor Brands. 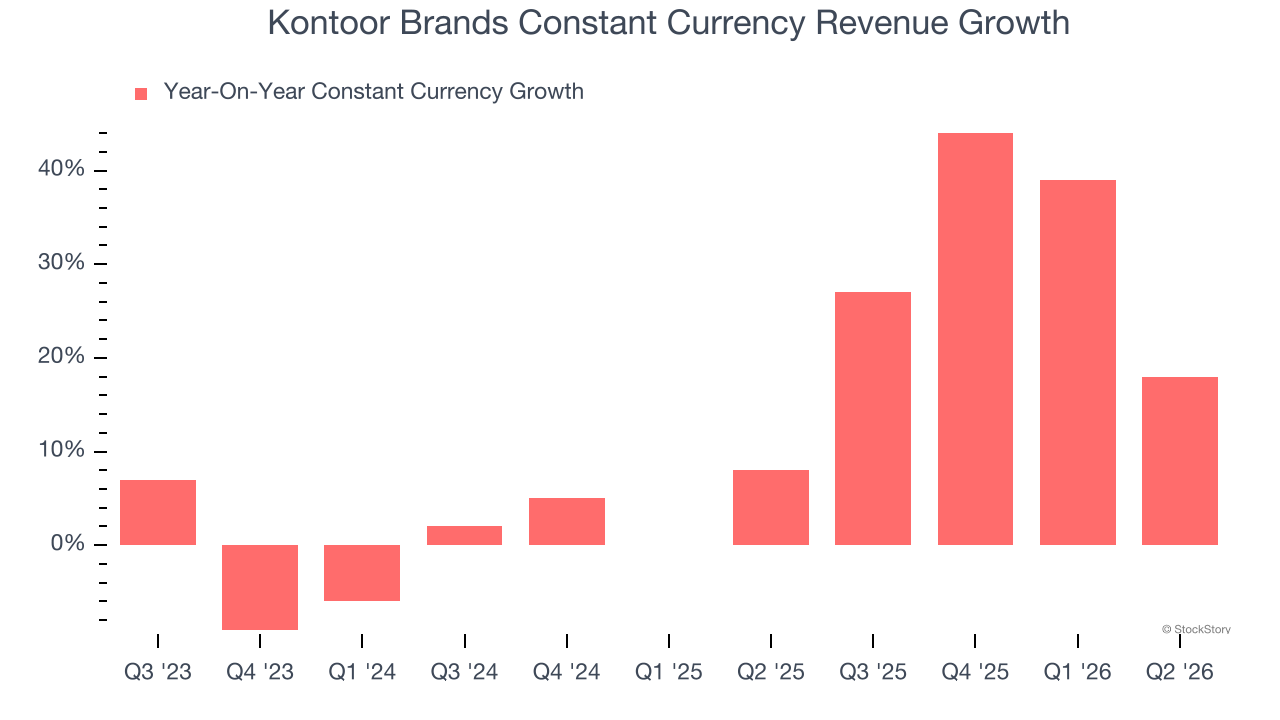
This quarter, Kontoor Brands’s year-on-year revenue growth was 18.5%, and its $584 million of revenue was in line with Wall Street’s estimates.
Looking ahead, sell-side analysts expect revenue to grow 4.8% over the next 12 months. While this projection indicates its newer products and services will catalyze better top-line performance, it is still below average for the sector.
ONE MORE THING: The $21 AI Application Stock Wall Street Forgot. While Wall Street obsesses over who’s building AI, one company is already using it to print money. And nobody’s paying attention.
AI chip stocks trade at ridiculous valuations. This company processes a trillion consumer signals monthly using AI and trades at a third of the price. The gap won’t last. The institutions will figure it out. You need to see this first. Read the FREE Report Before They Notice.
Operating Margin
Kontoor Brands’s operating margin has more or less stayed the same over the last 12 months , and we generally like to see margin increases due to economies of scale and cost efficiency over time.
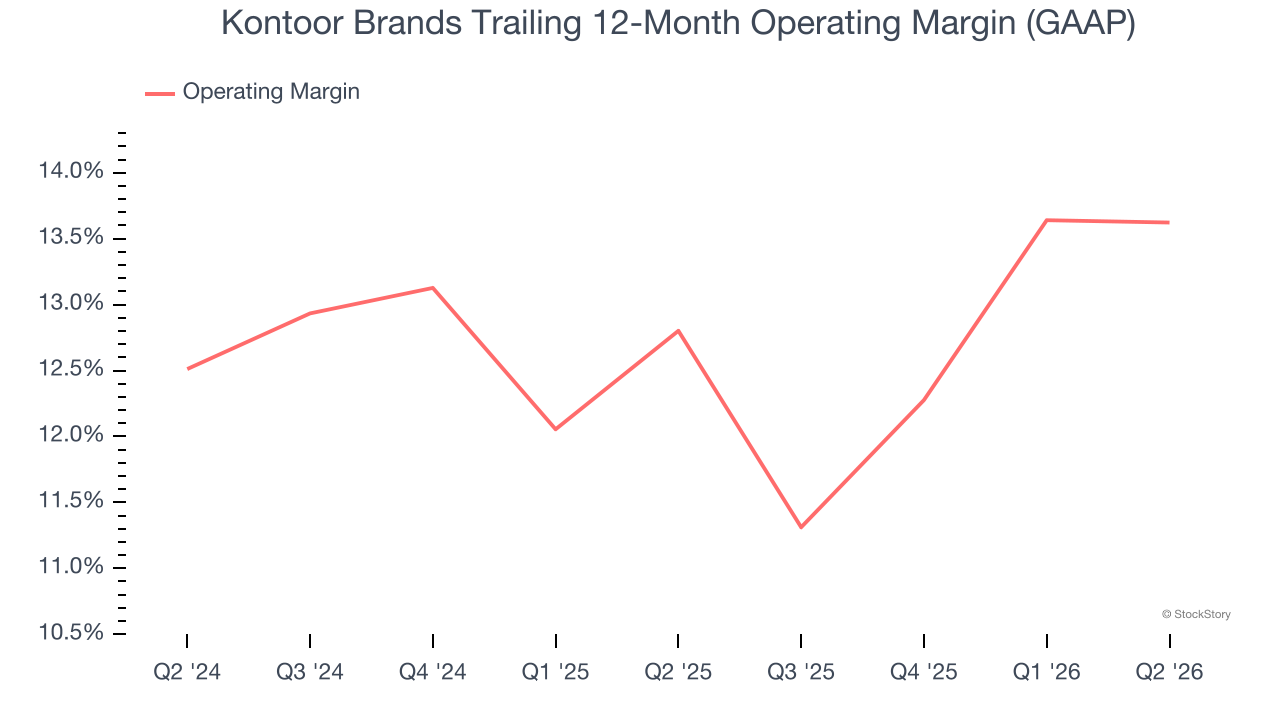
This quarter, Kontoor Brands generated an operating margin profit margin of 15.5%, in line with the same quarter last year. This indicates the company’s overall cost structure has been relatively stable.
Earnings Per Share
Revenue trends explain a company’s historical growth, but the long-term change in earnings per share (EPS) points to the profitability of that growth — for example, a company could inflate its sales through excessive spending on advertising and promotions.
Kontoor Brands’s weak 2.4% annual EPS growth over the last five years aligns with its revenue performance. On the bright side, this tells us its incremental sales were profitable.
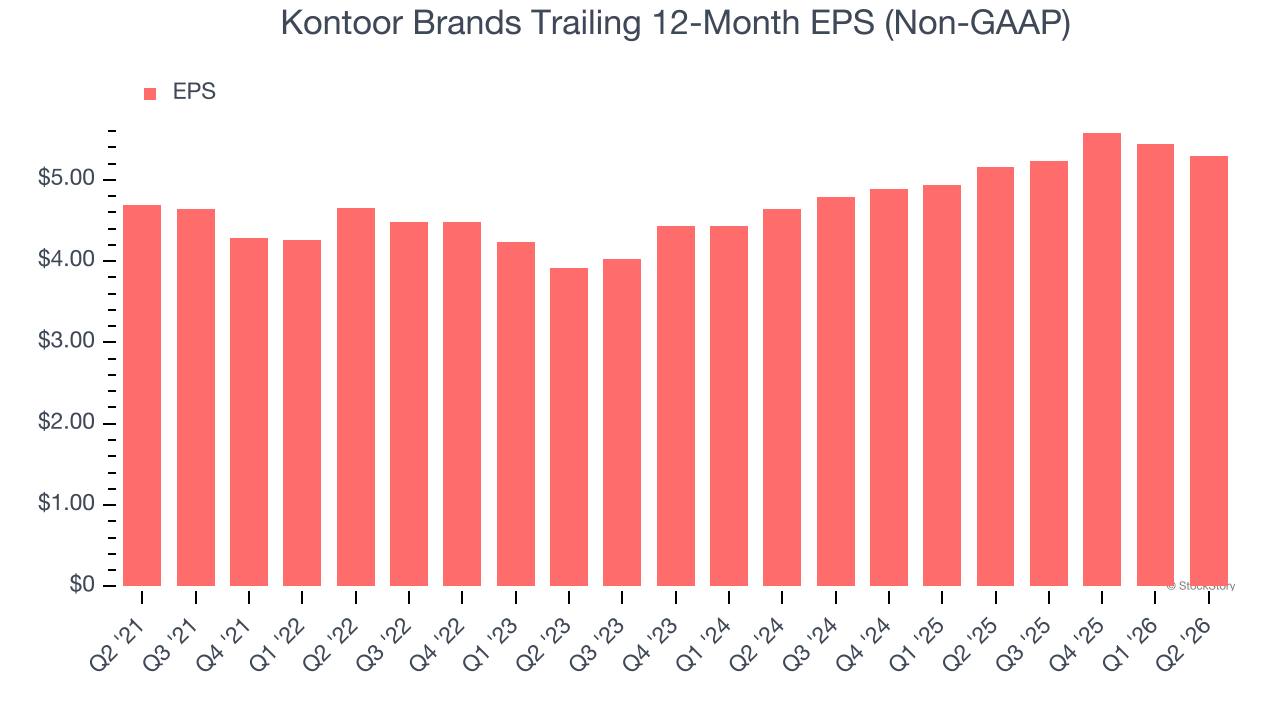
In Q2, Kontoor Brands reported adjusted EPS of $1.06, down from $1.21 in the same quarter last year. Despite falling year on year, this print beat analysts’ estimates by 2.1%. Over the next 12 months, Wall Street expects Kontoor Brands’s full-year EPS to grow 8.7% from $5.29 to $5.75.
Key Takeaways from Kontoor Brands’s Q2 Results
It was encouraging to see Kontoor Brands’s full-year EPS guidance beat analysts’ expectations. On the other hand, its full-year revenue guidance slightly missed and its EBITDA fell short of Wall Street’s estimates. Overall, this was a weaker quarter. The stock traded down 3.9% to $72.06 immediately following the results.
So do we think Kontoor Brands is an attractive buy at the current price? What happened in the latest quarter matters, but not as much as longer-term business quality and valuation, when deciding whether to invest in this stock. We cover that in our actionable full research report which you can read here (it’s free).