


Oilfield services provider SLB (NYSE: SLB) beat Wall Street’s revenue expectations in Q1 CY2026, but sales fell by 6.3% year on year to $8.72 billion. Its non-GAAP profit of $0.52 per share was in line with analysts’ consensus estimates.
Is now the time to buy SLB? Find out by accessing our full research report, it’s free.
SLB (SLB) Q1 CY2026 Highlights:
- Revenue: $8.72 billion vs analyst estimates of $8.63 billion (6.3% year-on-year decline, 1% beat)
- Adjusted EPS: $0.52 vs analyst estimates of $0.52 (in line)
- Adjusted EBITDA: $1.96 billion vs analyst estimates of $1.84 billion (22.5% margin, 6.8% beat)
- Operating Margin: 13.5%, down from 15.9% in the same quarter last year
- Free Cash Flow Margin: 1.7%, similar to the same quarter last year
- Market Capitalization: $82.17 billion
“It was a challenging start to the year as widespread disruptions in the Middle East impacted our business,” said SLB Chief Executive Officer Olivier Le Peuch.
Company Overview
What began in 1926 with two brothers logging the first electrical measurements in a well, SLB (NYSE: SLB) provides technology and services to help oil and gas companies locate reservoirs, drill wells, and produce hydrocarbons.
Revenue Growth
Cyclical industries such as Energy can make mediocre companies look great for a time, but a long-term view reveals which businesses can actually withstand and adapt to changing conditions. Over the last five years, SLB grew its sales at a decent 11.5% compounded annual growth rate. Its growth was slightly above the average energy upstream and integrated energy company and shows its offerings resonate with customers.
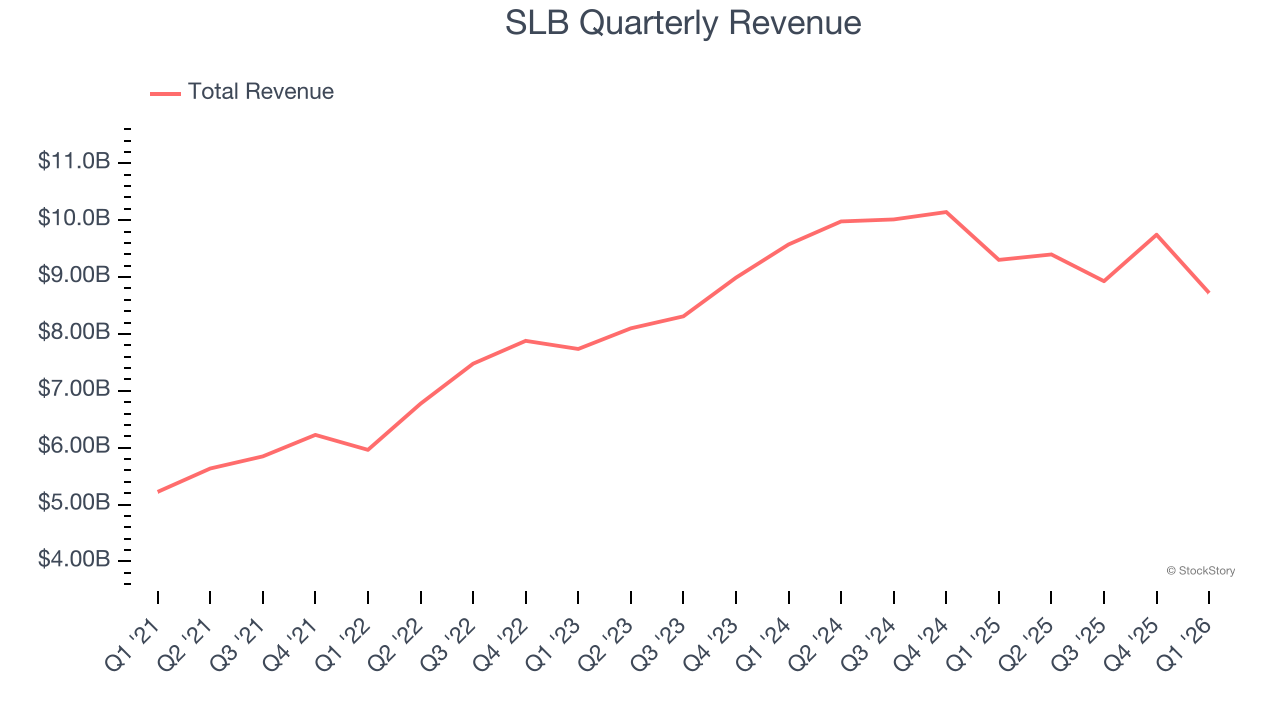
Energy cycles can be long enough that a single five-year period can still reflect one price environment, which is why an additional, decade-long view can help capture through-cycle performance. SLB’s annualized revenue growth of 0.2% over the last ten years is below its five-year trend, but we still think the results were respectable.
This quarter, SLB’s revenue fell by 6.3% year on year to $8.72 billion but beat Wall Street’s estimates by 1%.
ALSO WORTH WATCHING: Nvidia’s Quiet Partner. Nvidia’s chips cost a hundred grand. The connectors that make them work cost even more. One company makes them all.
Every AI server needs specialized infrastructure the chip companies don’t make. High-speed cables. Power connectors. Thermal sensors. This 90-year-old company built a monopoly on it. The AI boom just started. This stock is still flying under the radar. Claim The Stock Ticker Here for FREE.
Adjusted EBITDA Margin
SLB was profitable over the last five years but held back by its large cost base. Its average EBITDA margin of 23% was weak for an upstream and integrated energy business.
On the plus side, SLB’s EBITDA margin rose by 1.2 percentage points over the last year.
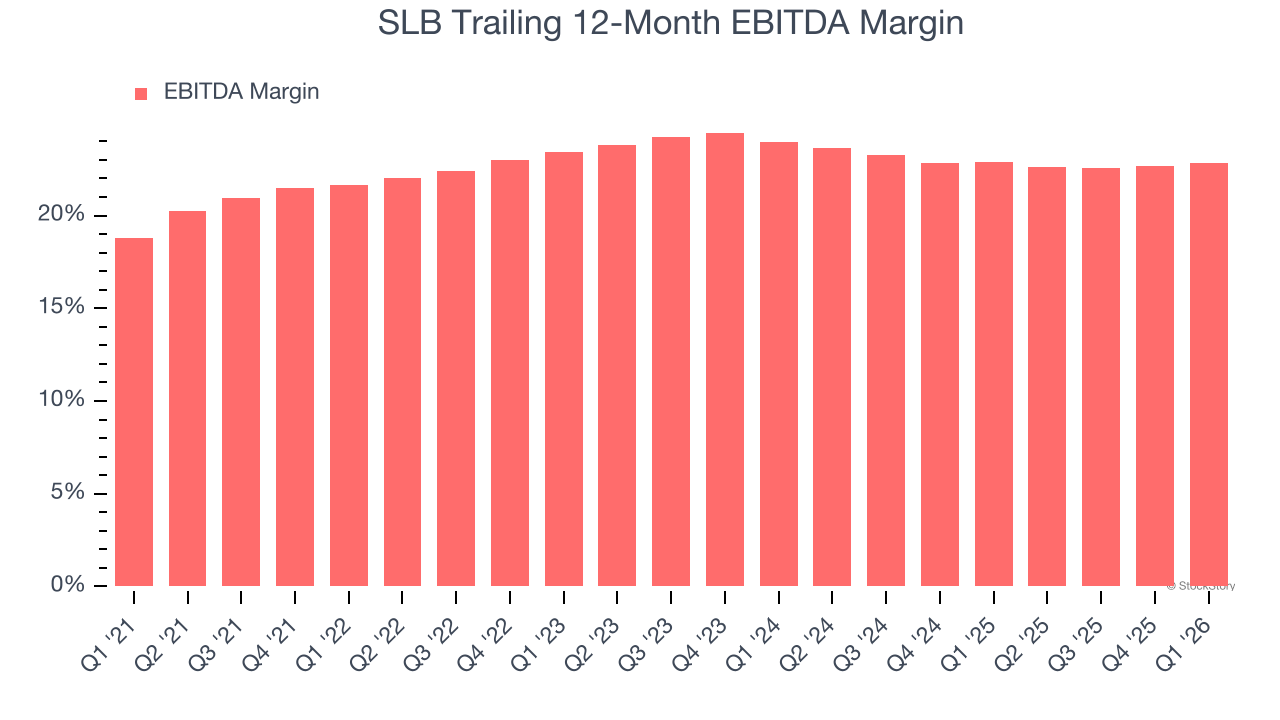
This quarter, SLB generated an EBITDA margin profit margin of 22.5%, in line with the same quarter last year. This indicates the company’s overall cost structure has been relatively stable. This adjusted EBITDA beat Wall Street’s estimates by 6.8%.
Cash Is King
Adjusted EBITDA shows how profitable a company’s existing “rock” is before financing and reinvestment, while free cash flow shows how much value remains after paying to replace those wells. Because production declines over time, strong EBITDA can coexist with weak FCF if drilling is expensive or declines are steep. FCF therefore captures both operating efficiency and the cost of sustaining production.
SLB has shown impressive cash profitability, giving it the option to reinvest or return capital to investors. The company’s free cash flow margin averaged 10% over the last five years, better than the broader energy upstream and integrated energy sector.
The level of free cash flow is important, but its durability across cycles is just as critical. Consistent margins are far more valuable than volatile swings driven by commodity prices.
SLB’s ratio of quarterly free cash flow volatility to WTI crude price volatility over the past five years was 6.4 (lower is better), indicating excellent insulation from commodity swings. This stability supports capital access in downturns and positions SLB to act as a consolidator when weaker peers are forced to retrench.
You may be asking why we wait until the free cash flow line to perform this stability analysis versus commodity prices. Why not compare revenue or EBITDA to WTI in the case of SLB? Because what ultimately matters is not how much revenue or profit you earn when prices are high but how much cash you can generate when prices are low. Free cash flow is the superior metric because it includes everything from hedging prowess to growth and maintenance capex to management behavior during good times and bad.
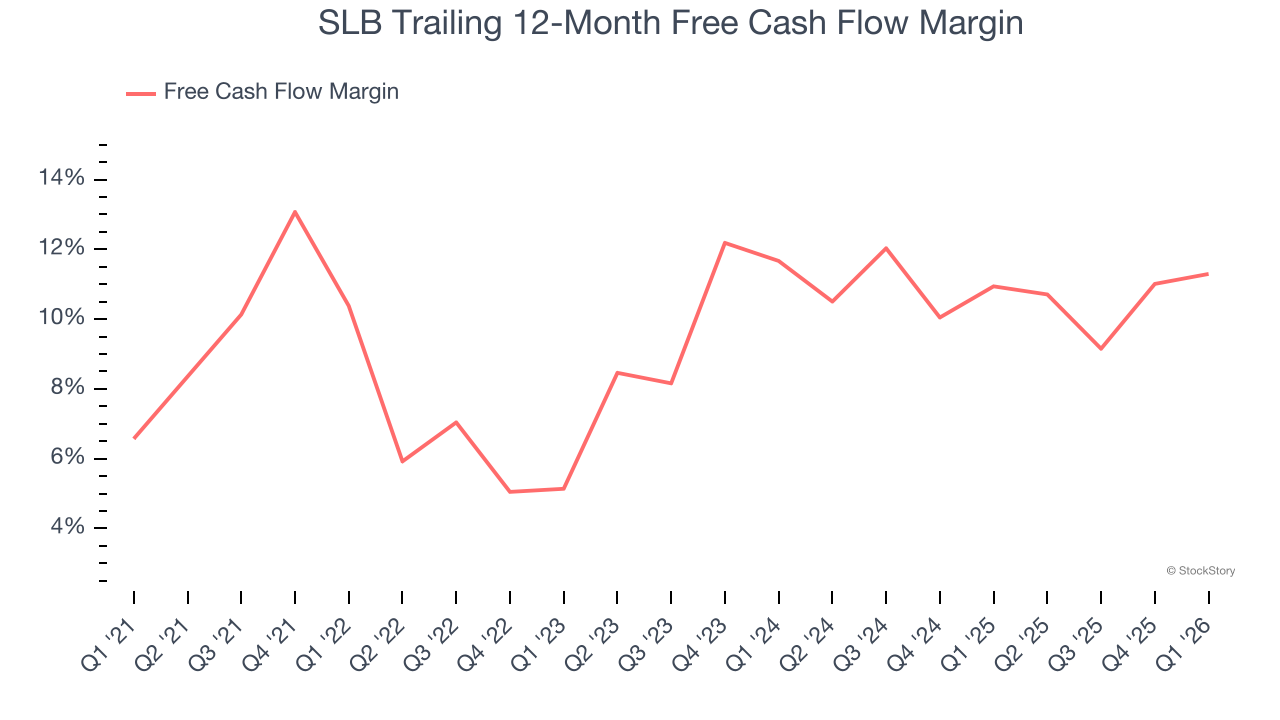
SLB’s free cash flow clocked in at $144 million in Q1, equivalent to a 1.7% margin. This cash profitability was in line with the comparable period last year but below its five-year average. In a silo, this isn’t a big deal because investment needs can be seasonal, but we’ll be watching to see if the trend extrapolates into future quarters.
Key Takeaways from SLB’s Q1 Results
Revenue and EPS were just in line. On the positive side, it was encouraging to see SLB beat analysts’ EBITDA expectations this quarter. Overall, this print had some key positives. Investors were likely hoping for more, and shares traded down 3.3% to $52.94 immediately after reporting.
Should you buy the stock or not? We think that the latest quarter is only one piece of the longer-term business quality puzzle. Quality, when combined with valuation, can help determine if the stock is a buy. We cover that in our actionable full research report which you can read here (it’s free).


