Electrical safety company Atkore (NYSE: ATKR) beat Wall Street’s revenue expectations in Q4 CY2025, but sales were flat year on year at $655.5 million. Its non-GAAP profit of $0.83 per share was 31.8% above analysts’ consensus estimates.
Is now the time to buy Atkore? Find out by accessing our full research report, it’s free.
Atkore (ATKR) Q4 CY2025 Highlights:
- Revenue: $655.5 million vs analyst estimates of $649.9 million (flat year on year, 0.9% beat)
- Adjusted EPS: $0.83 vs analyst estimates of $0.63 (31.8% beat)
- Adjusted EBITDA: $69.15 million vs analyst estimates of $59.07 million (10.5% margin, 17.1% beat)
- Management reiterated its full-year Adjusted EPS guidance of $5.30 at the midpoint
- EBITDA guidance for the full year is $350 million at the midpoint, above analyst estimates of $346.1 million
- Operating Margin: 3.1%, down from 10.3% in the same quarter last year
- Free Cash Flow was -$67.26 million, down from $33.08 million in the same quarter last year
- Market Capitalization: $2.36 billion
“Atkore’s first quarter results were above our expectations in several areas of the business,” said Bill Waltz, Atkore President and Chief Executive Officer.
Company Overview
Protecting the things that power our world, Atkore (NYSE: ATKR) designs and manufactures electrical safety products.
Revenue Growth
A company’s long-term performance is an indicator of its overall quality. Even a bad business can shine for one or two quarters, but a top-tier one grows for years. Over the last five years, Atkore grew its sales at a solid 9.2% compounded annual growth rate. Its growth beat the average industrials company and shows its offerings resonate with customers.
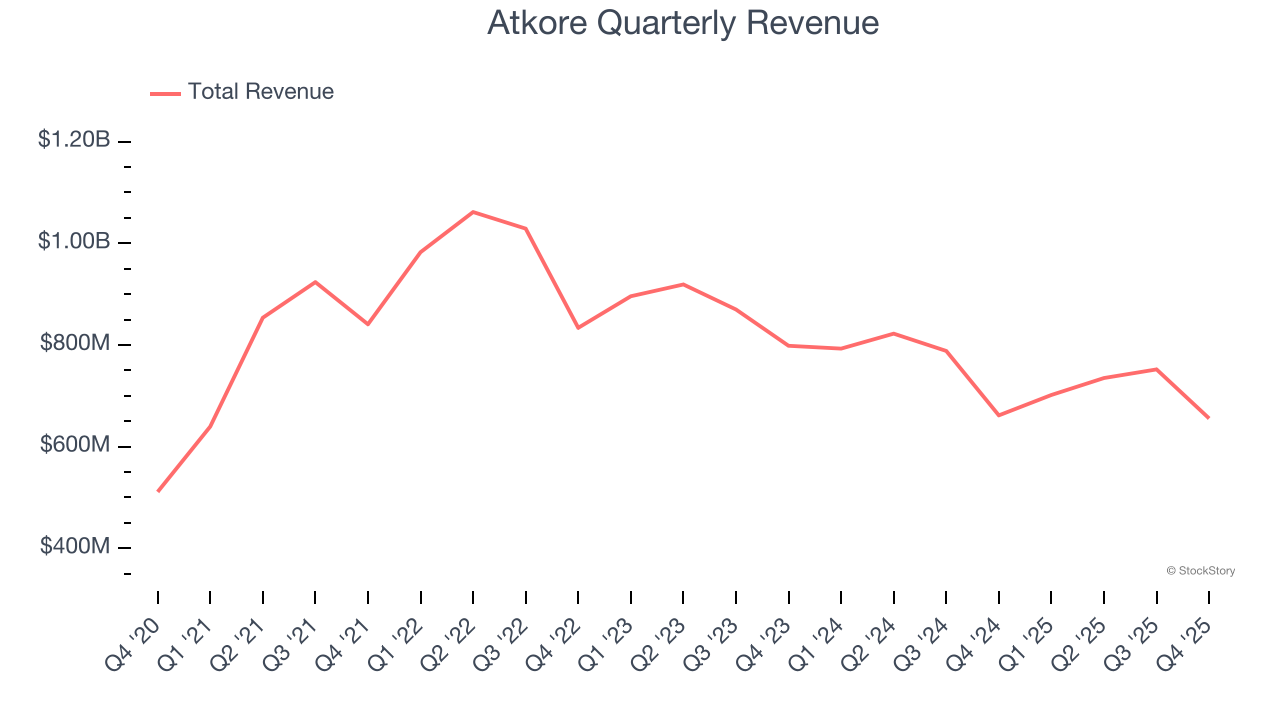
Long-term growth is the most important, but within industrials, a half-decade historical view may miss new industry trends or demand cycles. Atkore’s recent performance marks a sharp pivot from its five-year trend as its revenue has shown annualized declines of 9.6% over the last two years. 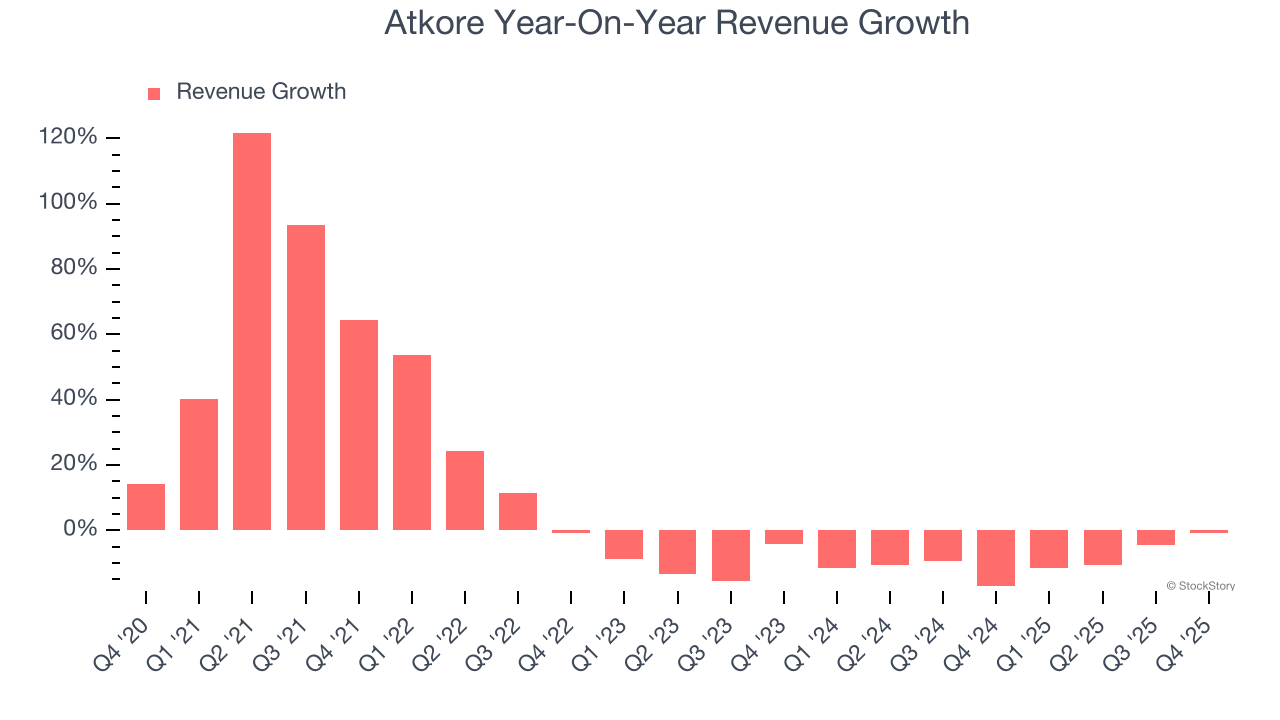
This quarter, Atkore’s $655.5 million of revenue was flat year on year but beat Wall Street’s estimates by 0.9%.
Looking ahead, sell-side analysts expect revenue to grow 6.6% over the next 12 months. Although this projection suggests its newer products and services will catalyze better top-line performance, it is still below the sector average.
While Wall Street chases Nvidia at all-time highs, an under-the-radar semiconductor supplier is dominating a critical AI component these giants can’t build without. Click here to access our free report one of our favorites growth stories.
Operating Margin
Atkore has been a well-oiled machine over the last five years. It demonstrated elite profitability for an industrials business, boasting an average operating margin of 21%. This result isn’t too surprising as its gross margin gives it a favorable starting point.
Looking at the trend in its profitability, Atkore’s operating margin decreased by 30 percentage points over the last five years. This raises questions about the company’s expense base because its revenue growth should have given it leverage on its fixed costs, resulting in better economies of scale and profitability.
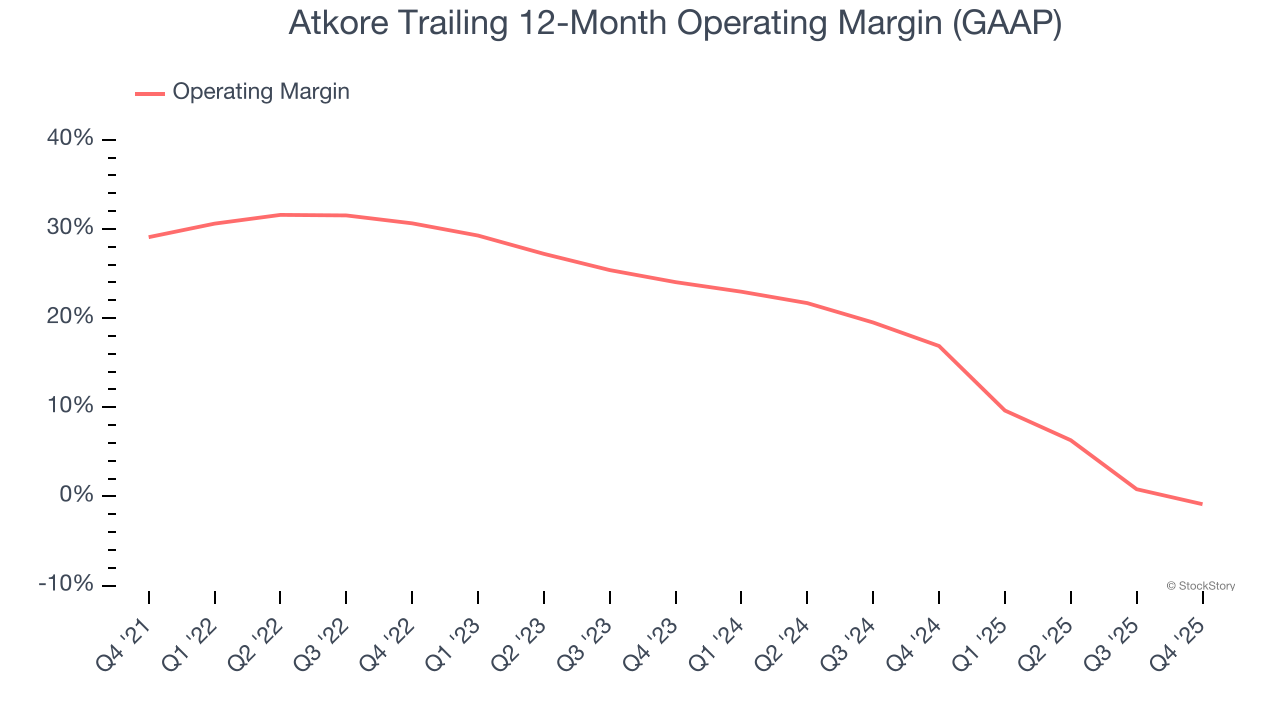
This quarter, Atkore generated an operating margin profit margin of 3.1%, down 7.2 percentage points year on year. Since Atkore’s operating margin decreased more than its gross margin, we can assume it was less efficient because expenses such as marketing, R&D, and administrative overhead increased.
Earnings Per Share
We track the long-term change in earnings per share (EPS) for the same reason as long-term revenue growth. Compared to revenue, however, EPS highlights whether a company’s growth is profitable.
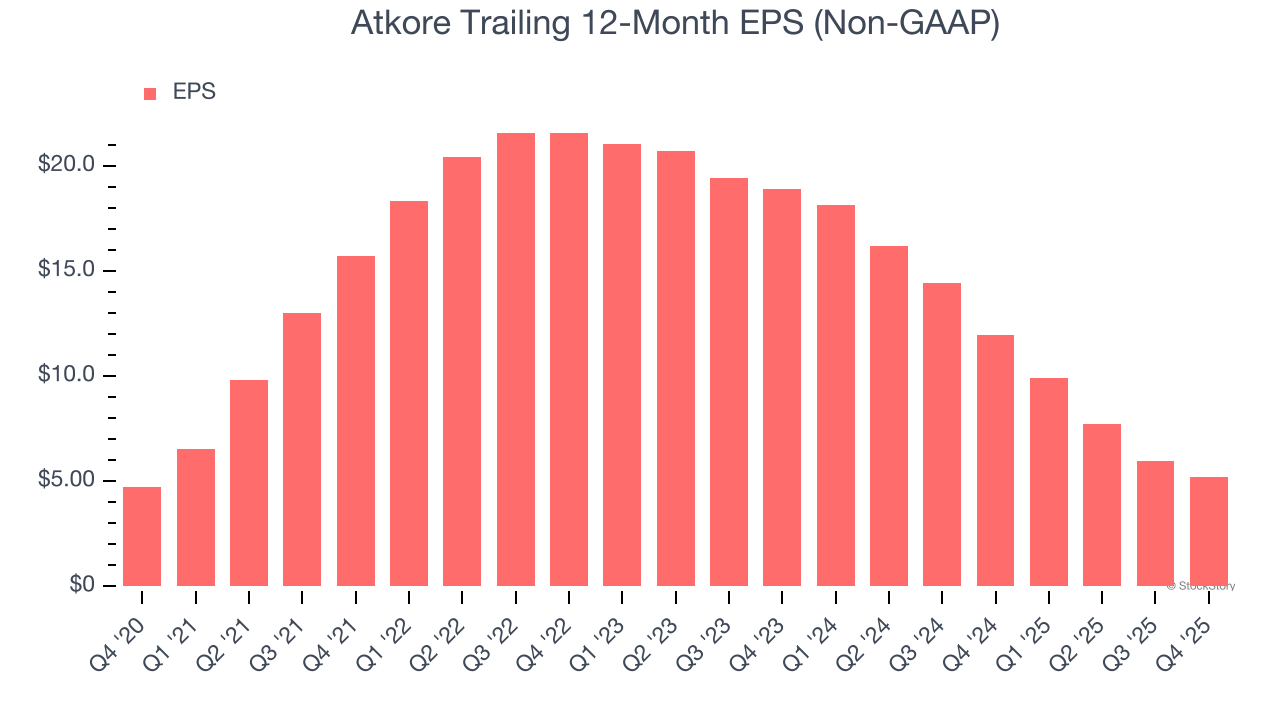
Atkore’s EPS grew at a weak 1.9% compounded annual growth rate over the last five years, lower than its 9.2% annualized revenue growth. This tells us the company became less profitable on a per-share basis as it expanded due to non-fundamental factors such as interest expenses and taxes.
We can take a deeper look into Atkore’s earnings to better understand the drivers of its performance. As we mentioned earlier, Atkore’s operating margin declined by 30 percentage points over the last five years. This was the most relevant factor (aside from the revenue impact) behind its lower earnings; interest expenses and taxes can also affect EPS but don’t tell us as much about a company’s fundamentals.
Like with revenue, we analyze EPS over a shorter period to see if we are missing a change in the business.
For Atkore, its two-year annual EPS declines of 47.6% show it’s continued to underperform. These results were bad no matter how you slice the data.
In Q4, Atkore reported adjusted EPS of $0.83, down from $1.63 in the same quarter last year. Despite falling year on year, this print easily cleared analysts’ estimates. Over the next 12 months, Wall Street expects Atkore’s full-year EPS of $5.19 to grow 5.6%.
Key Takeaways from Atkore’s Q4 Results
It was good to see Atkore beat analysts’ EBITDA and EPS expectations convincingly this quarter. We were also excited its full-year EPS guidance was raised. Zooming out, we think this quarter featured some important positives. The stock remained flat at $70.10 immediately following the results.
Atkore had an encouraging quarter, but one earnings result doesn’t necessarily make the stock a buy. Let’s see if this is a good investment. What happened in the latest quarter matters, but not as much as longer-term business quality and valuation, when deciding whether to invest in this stock. We cover that in our actionable full research report which you can read here (it’s free).