Manufacturing company Stanley Black & Decker (NYSE: SWK) met Wall Street’s revenue expectations in Q3 2026, but revenue was flat year on year at $3.73 billion. Its non-GAAP profit of $2.31 per share was 48.3% above analysts’ consensus estimates.
For more on Stanley Black & Decker, read our free full research report.
Stanley Black & Decker (SWK) Q3 2026 highlights:
- Revenue $3.73 billion vs S&P analysts’ consensus estimates of $3.74 billion (flat year on year, in line)
- Adjusted EPS $2.31 (includes $0.67 one-time benefit from net tariff refunds) vs S&P analysts’ estimates of $1.56 (48.3% beat)
- Adjusted EBITDA $609.1 million (favorably impacted by one-time benefit from net tariff refunds) vs analyst estimates of $471.5 million (16.3% margin, 29.2% beat)
- Adjusted EPS guidance Management raised its full-year adjusted EPS guidance to $6.10 at the midpoint, a 10.9% increase
- Operating margin 11.1%, in line with the same quarter last year
- Free cash flow margin 15.7%, up from 4.1% in the same quarter last year
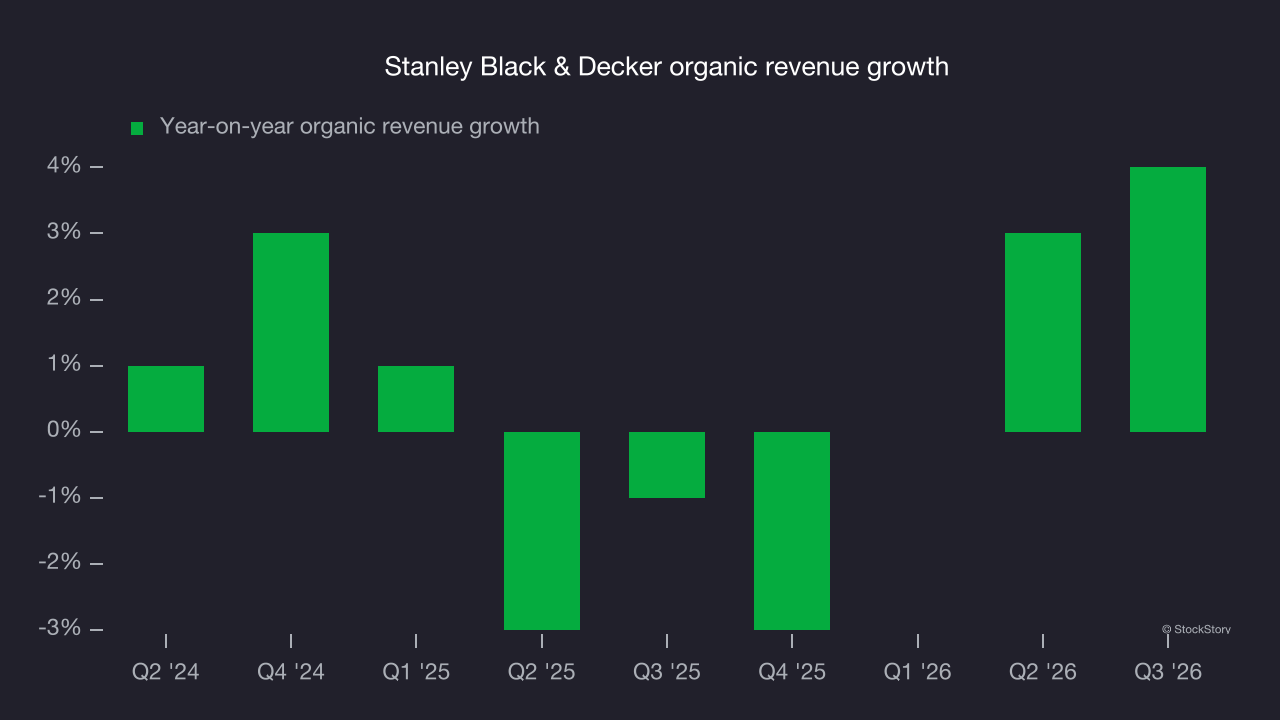
- Organic revenue rose 4% year on year (beat)
- Market capitalization $15.8 billion
"As we continue building momentum in the business, we remain focused on disciplined execution to drive profitable growth and long-term shareholder value. The Board's new share repurchase authorization extends our flexibility to continue returning capital to shareholders in a thoughtful and balanced manner, while we invest in the business to advance our strategic priorities and create value."
Revenue growth
Reviewing a company’s long-term revenue performance reveals insights into its quality. Any business can have short-term success, but a high-quality one grows for years. Stanley Black & Decker struggled to consistently increase demand as its $15.22 billion in revenue for the trailing 12 months was close to its revenue five years ago. That underwhelming result is a sign of poor business quality.
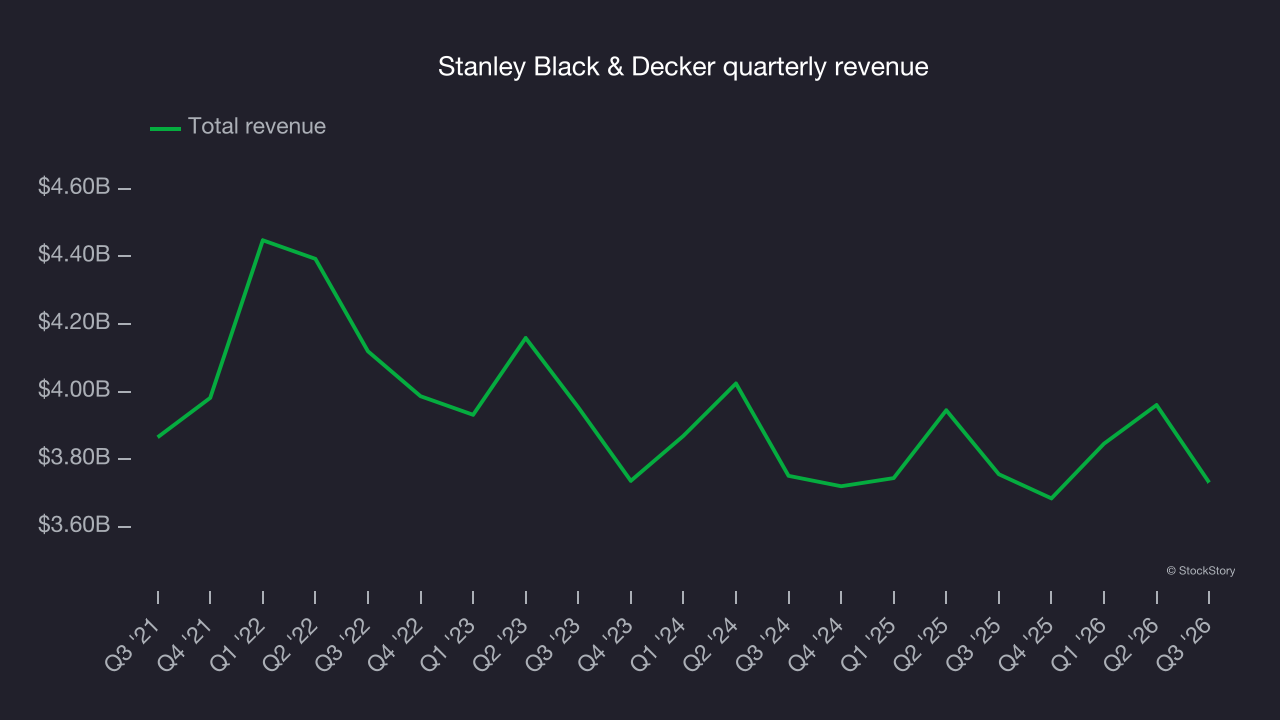
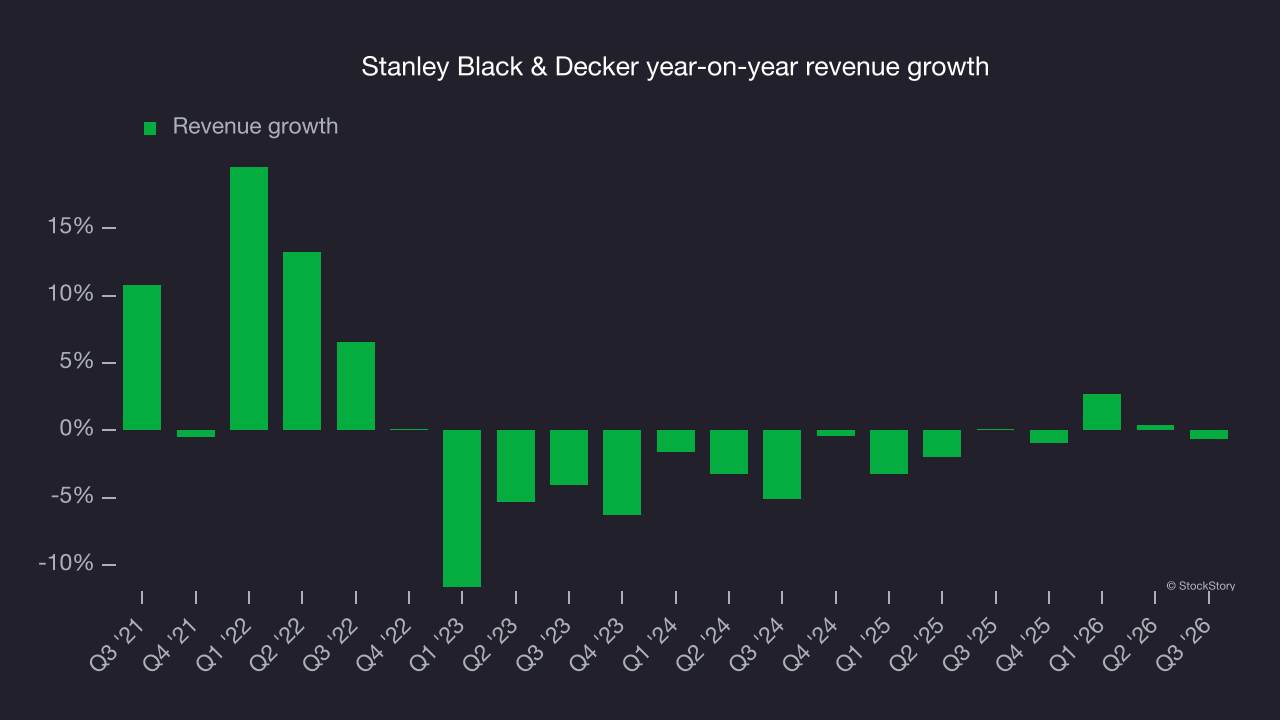
Long-term growth matters most, but within industrials, a half-decade historical view may miss cycles, industry trends or a company capitalizing on catalysts such as a new contract win or a successful product line. Just like its five-year trend, Stanley Black & Decker’s revenue over the last two years was flat, suggesting it is in a slump.
Stanley Black & Decker also reports organic revenue, which strips out one-time events like acquisitions and currency fluctuations that don’t accurately reflect its fundamentals. Over the last two years, Stanley Black & Decker’s organic revenue was flat. This was in line with its two-year revenue growth, indicating that core operations, rather than acquisitions and divestitures, drove most of its results.
This quarter, Stanley Black & Decker’s $3.73 billion in revenue was flat year on year and in line with Wall Street’s consensus estimates.
Looking ahead, sell-side analysts expect revenue to remain flat over the next 12 months, according to S&P. This underwhelming outlook implies its newer products and services will not yet accelerate revenue growth.
Operating margin
Stanley Black & Decker was profitable over the last five years but held back by its large cost base. Its average operating margin of 6.6% was weak for an industrials business. That outcome is unsurprising given its low gross margin baseline.
On the positive side, Stanley Black & Decker’s operating margin rose by 3.1 percentage points over the last five years.
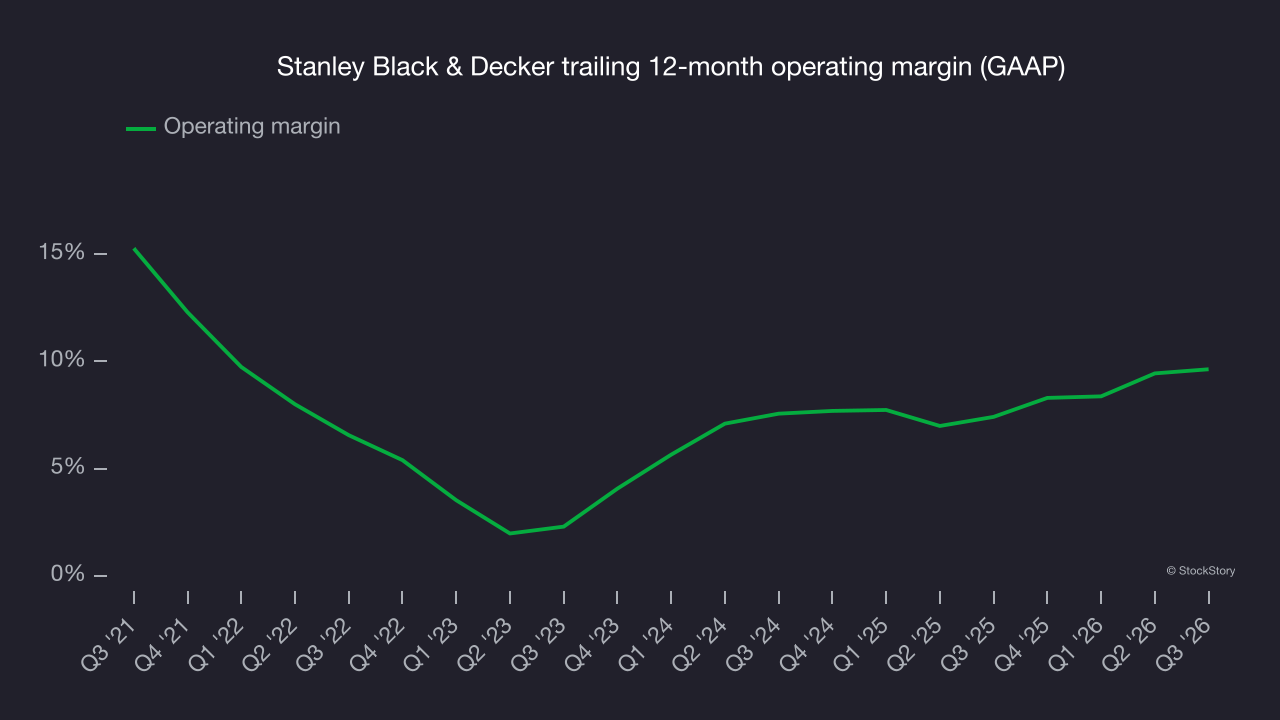
In Q3, Stanley Black & Decker generated an operating margin of 11.1%, in line with the same quarter last year. This indicates the company’s cost structure has recently been stable.
Earnings per share
Revenue trends explain a company’s historical growth, but the long-term change in earnings per share, or EPS, points to the profitability of that growth. For example, a company could inflate its revenue through excessive spending on advertising and promotions.
Stanley Black & Decker’s EPS declined by 13.1% annually over the last five years while its revenue was flat. The difference stemmed from higher interest expenses or taxes, as the company improved its operating margin and repurchased its shares during this time.
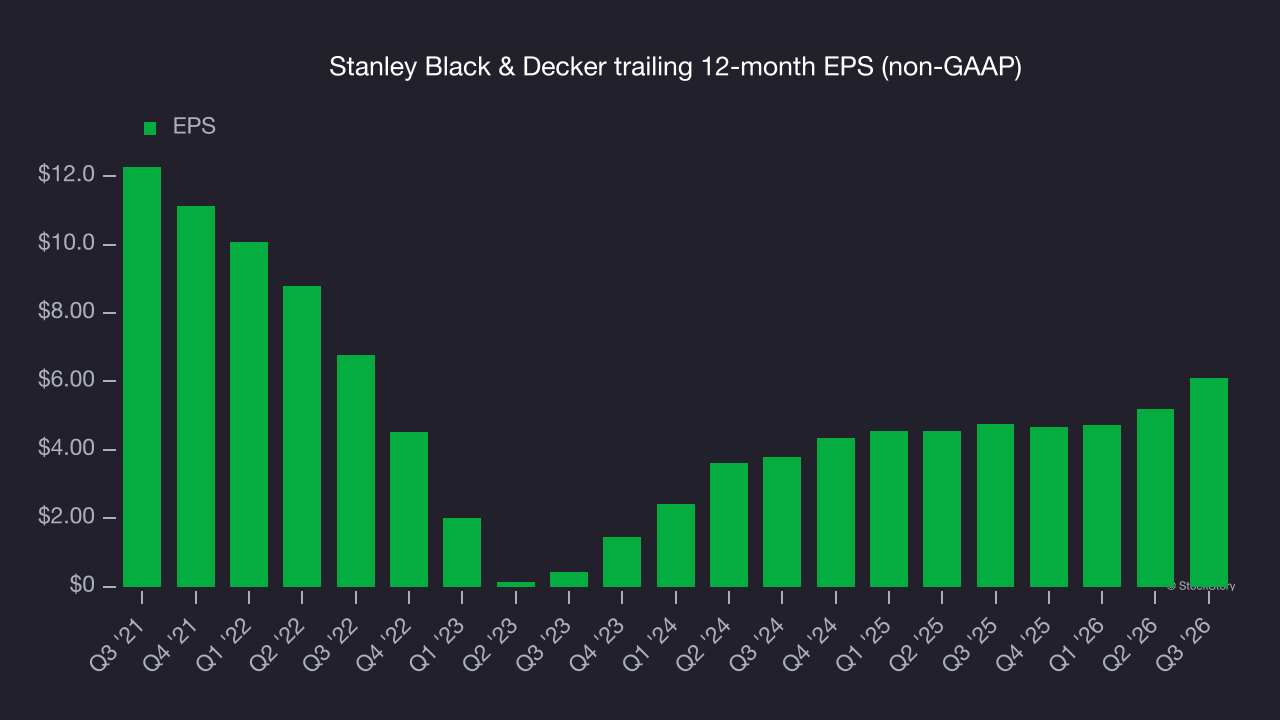
As with revenue, analyzing EPS over a shorter period can reveal a change in the business.
Stanley Black & Decker’s two-year annual EPS growth of 26.8% was strong and outpaced its flat revenue.
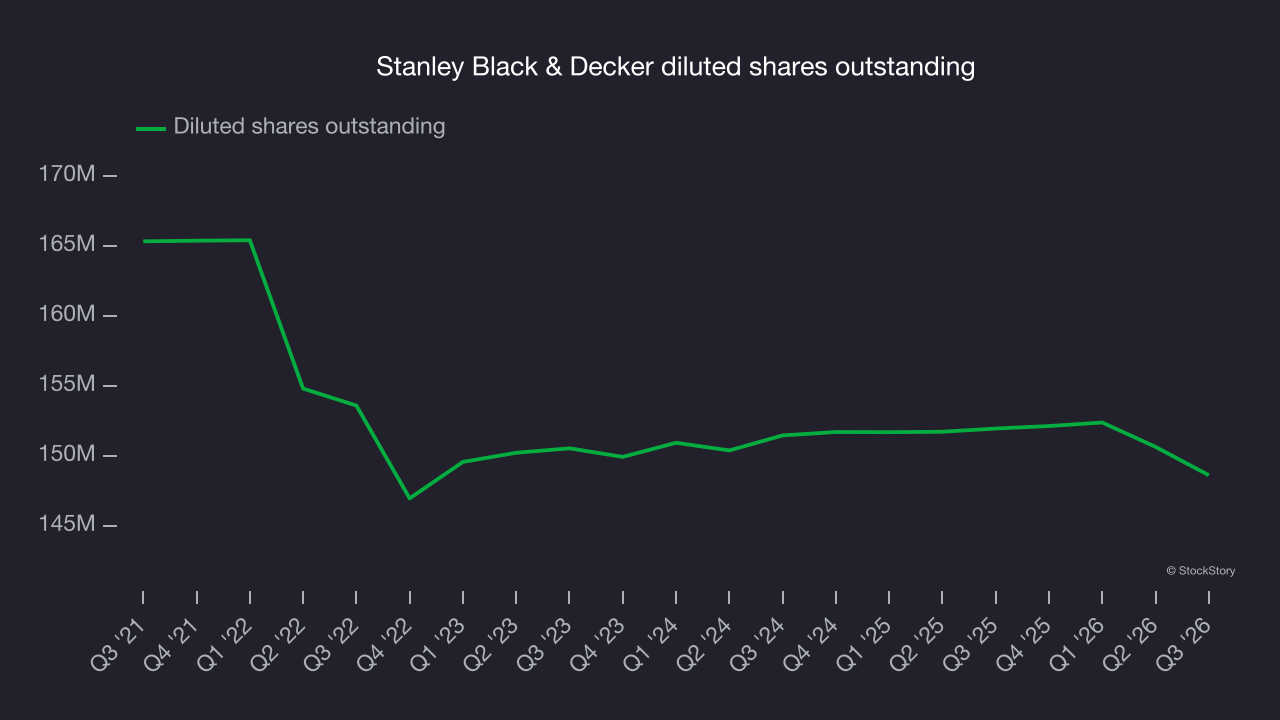
A closer look at Stanley Black & Decker’s earnings helps explain its performance. While Stanley Black & Decker’s operating margin was flat this quarter, as noted earlier, a two-year view shows its margin has expanded while its share count has shrunk 1.9%. Improving profitability and share buybacks are positive signs for shareholders as they boost EPS growth relative to revenue growth.
In Q3, Stanley Black & Decker reported adjusted EPS of $2.31, up from $1.43 in the same quarter last year. EPS easily cleared analysts’ consensus estimates, a positive result for shareholders. Over the next 12 months, Wall Street expects Stanley Black & Decker’s full-year EPS to stay about the same, moving from $6.09 to $6.09, according to S&P.
Key takeaways from Stanley Black & Decker’s Q3 results
Stanley Black & Decker delivered a solid Q3, with EPS beating analysts’ consensus estimates and EBITDA topping Wall Street’s consensus by a wide margin. Those earnings beats were key positives in the quarter. Shares edged higher 1.8% to $106.47 immediately after the report.
Stanley Black & Decker may have had a good quarter, but that alone does not determine whether the stock is a good investment. That decision should account for the bigger picture of valuation, business quality and the latest earnings. For more on these factors, read the full research report here (it’s free).