Insurance brokerage firm Arthur J. Gallagher (NYSE: AJG) missed Wall Street’s revenue expectations in Q3 2026, but revenue rose 17.9% year on year to $3.98 billion. Its non-GAAP profit of $3 per share was in line with analysts’ consensus estimates.
For more on Arthur J. Gallagher, read our free full research report.
Arthur J. Gallagher (AJG) Q3 2026 highlights:
- Revenue $3.98 billion vs S&P analysts’ consensus estimates of $4.00 billion (17.9% year-on-year growth, 0.6% miss)
- Adjusted EPS $3 vs S&P analysts’ consensus estimates of $2.99 (in line)
- Adjusted EBITDA $1.25 billion vs analysts’ consensus estimates of $1.26 billion (31.5% margin, 0.5% miss)
- Market capitalization $66.76 billion
"These results demonstrate the strength and resilience of our diversified model as market conditions evolve. As risk becomes more complex, our clients continue to value our advice, advocacy, analytics and market access. We have a terrific team, a proven strategy and significant opportunities ahead of us, and we remain very confident in our ability to create long-term value for our clients, colleagues and shareholders."
Revenue growth
A company’s long-term performance is an indicator of its overall quality. Even a weak business can perform well for one or two quarters, but a high-quality one grows for years.
With $16.33 billion in revenue over the past 12 months, Arthur J. Gallagher is a large company in the business services sector and benefits from economies of scale, giving it an edge in distribution. This also gives it more leverage on its fixed costs than smaller competitors and the flexibility to offer lower prices.
Arthur J. Gallagher’s 15.5% annualized revenue growth over the last five years was strong, showing its demand was higher than that of many business services companies.
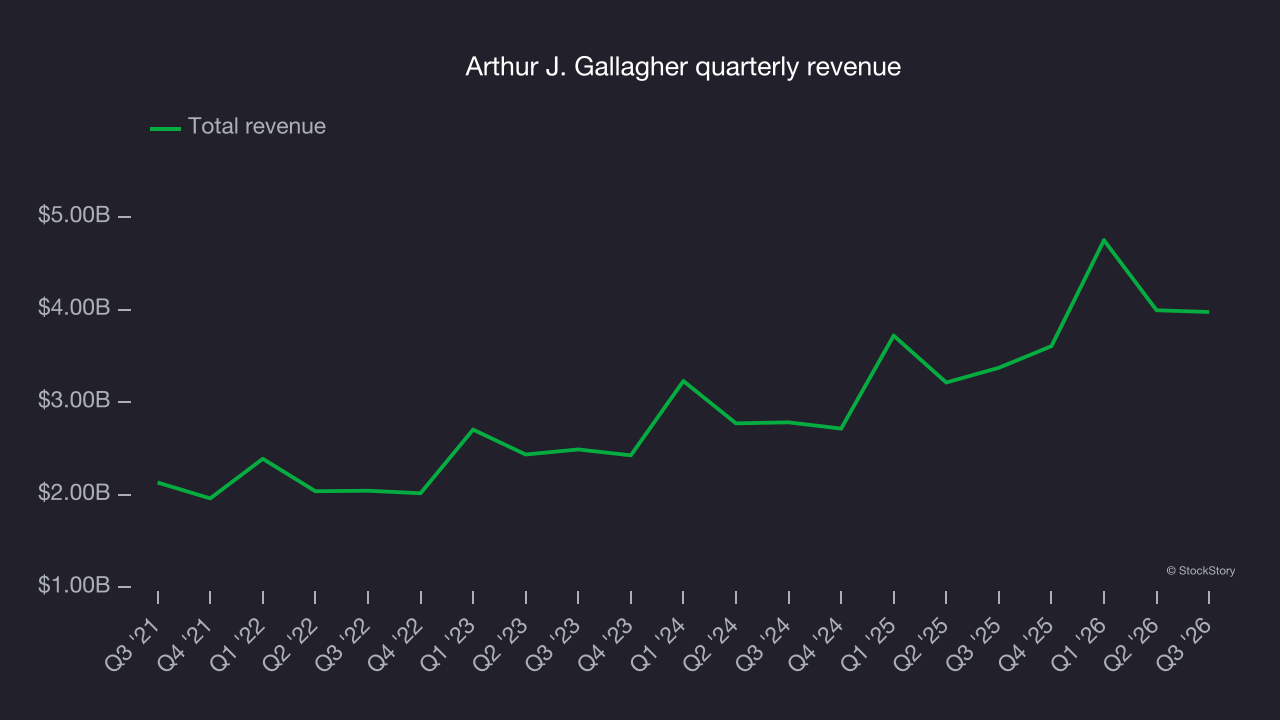
Long-term growth is the most important, but within business services, a half-decade historical view may miss new innovations or demand cycles. Arthur J. Gallagher’s annualized revenue growth of 20.7% over the last two years is above its five-year trend, suggesting its demand was strong and recently accelerated. 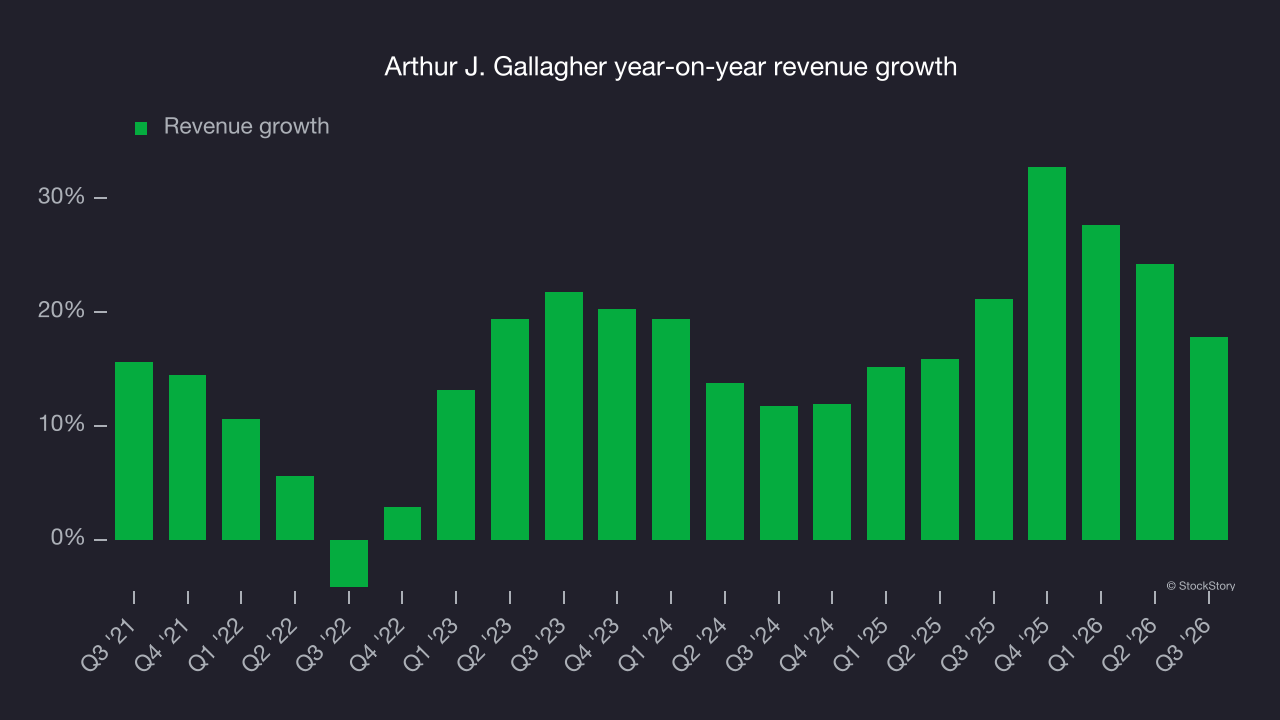
We can better understand the company’s revenue dynamics by analyzing its most important segment, Insurance Brokerage. Over the last two years, Arthur J. Gallagher’s Insurance Brokerage revenue (commissions and fees) averaged 22.5% year-on-year growth. 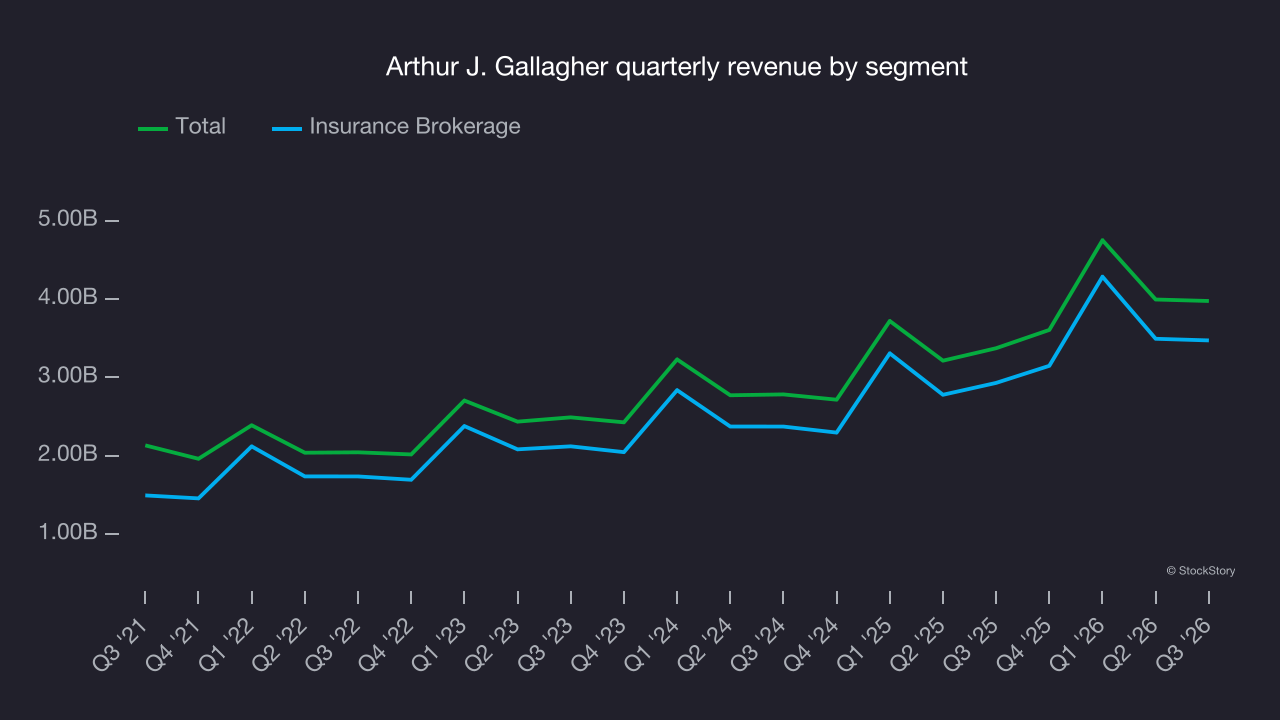
This quarter, Arthur J. Gallagher’s revenue grew by 17.9% year on year to $3.98 billion but fell short of Wall Street’s consensus estimates.
Looking ahead, sell-side analysts expect revenue to grow 8.5% over the next 12 months, according to S&P, a deceleration versus the last two years. Its growth trajectory remains attractive given its scale and indicates the market is factoring in success for its products and services.
Operating margin
Arthur J. Gallagher has been an efficient company over the last five years. It was one of the more profitable businesses in the business services sector, with an average operating margin of 14.3%.
Looking at the trend in its profitability, Arthur J. Gallagher’s operating margin decreased by 2.4 percentage points over the last five years. This raises questions about the company’s expense base because its revenue growth should have given it leverage on its fixed costs, resulting in better economies of scale and profitability.
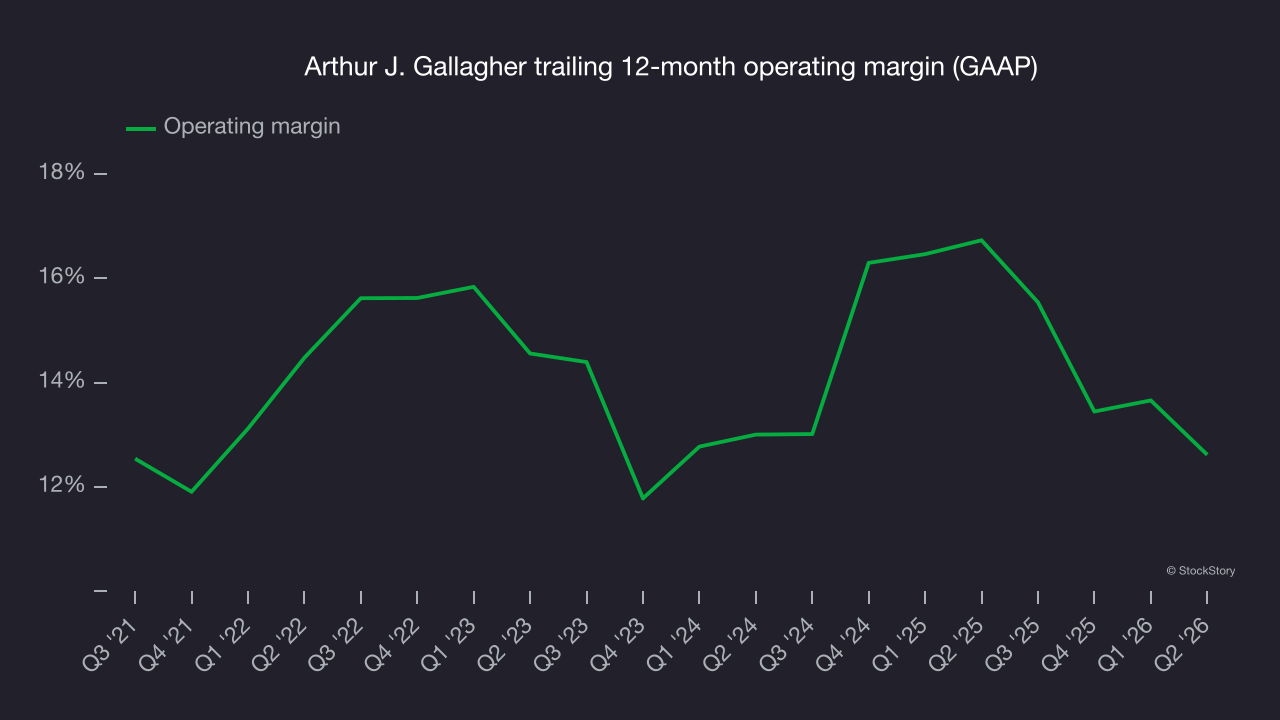
in line with the same quarter last year. This indicates the company’s overall cost structure has been relatively stable.
Earnings per share
Revenue trends explain a company’s historical growth, but the long-term change in earnings per share (EPS) points to the profitability of that growth. For example, a company could inflate its revenue through excessive spending on advertising and promotions.
Arthur J. Gallagher’s EPS grew at an 18.6% compounded annual growth rate over the last five years, higher than its 15.5% annualized revenue growth. However, that comparison warrants caution because its operating margin didn’t improve and it didn’t repurchase its shares, meaning the difference came from reduced interest expenses or taxes.
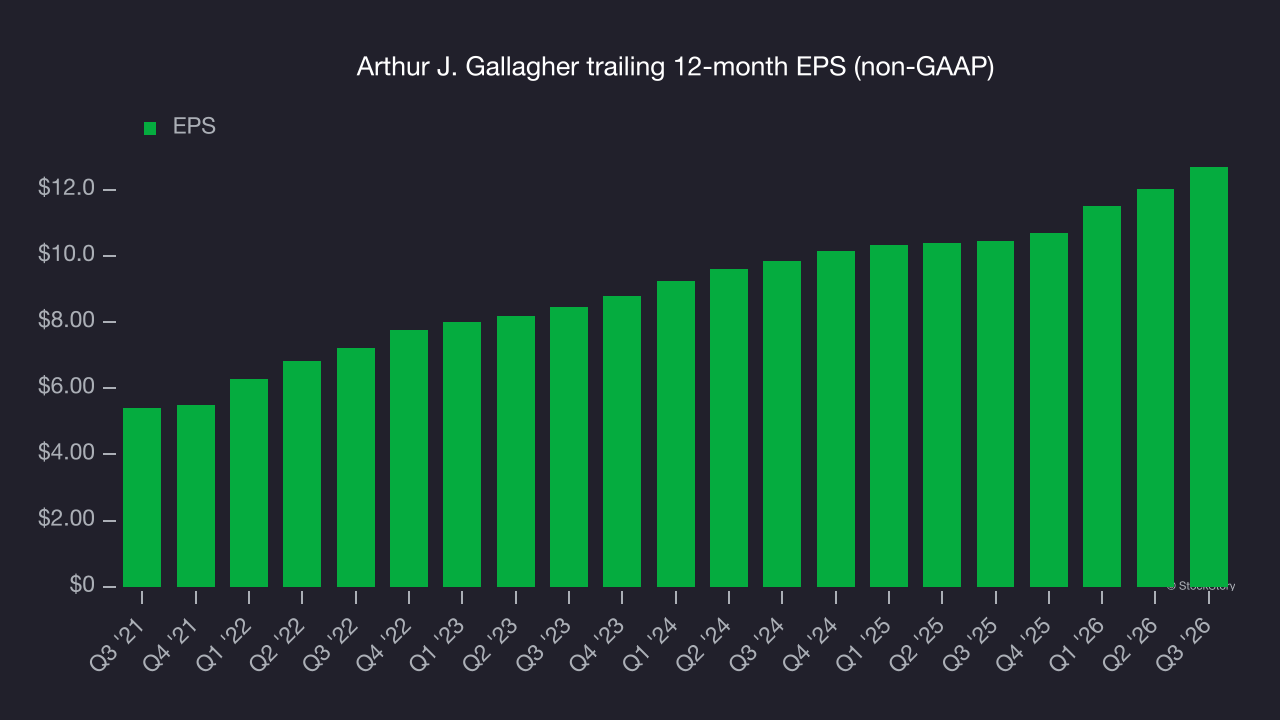
As with revenue, we analyze EPS over a shorter period to check for changes in the business.
Although it performed well, Arthur J. Gallagher’s two-year annual EPS growth of 13.4% was lower than its 20.7% two-year revenue growth.
Examining Arthur J. Gallagher’s quality of earnings can give us a better understanding of its performance. A two-year view shows Arthur J. Gallagher has diluted its shareholders, growing its share count by 15.8%. This has led to lower per share earnings. Taxes and interest expenses can also affect EPS but don’t tell us as much about a company’s fundamentals. 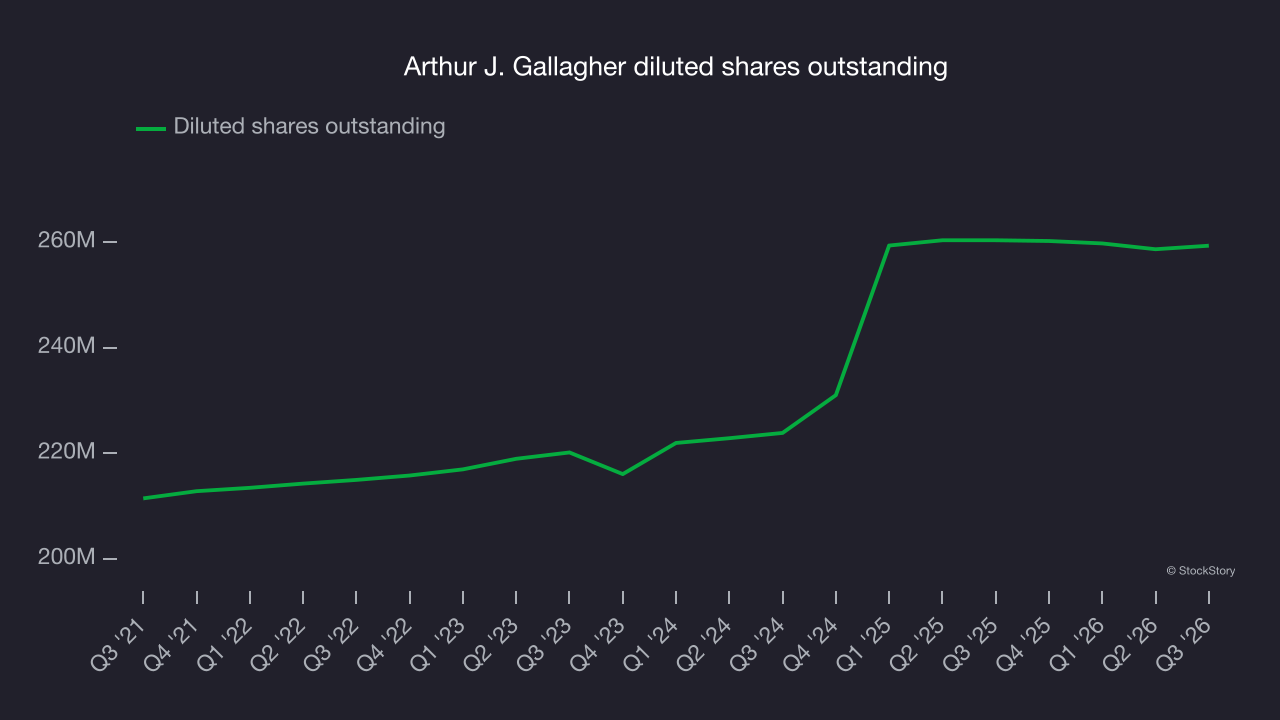
In Q3, Arthur J. Gallagher reported adjusted EPS of $3, up from $2.32 in the same quarter last year. This result was close to analysts’ consensus estimates. Over the next 12 months, Wall Street expects Arthur J. Gallagher’s full-year EPS to grow 13.8% from $12.69 to $14.44, according to S&P.
Key takeaways from Arthur J. Gallagher’s Q3 results
Few positives stood out in Arthur J. Gallagher’s softer quarterly results. Shares remained flat at $265.53 immediately after the release.
Arthur J. Gallagher had a disappointing quarter, but does that create a buying opportunity? The latest quarter is only one piece of the longer-term business quality puzzle. Quality, when combined with valuation, can help determine if the stock is a buy. For more on Arthur J. Gallagher, read our free full research report here.