


Electronic brokerage firm Interactive Brokers (NASDAQ: IBKR) beat Wall Street’s revenue expectations in Q4 CY2025, with sales up 15.4% year on year to $1.64 billion. Its non-GAAP profit of $0.65 per share was 11% above analysts’ consensus estimates.
Is now the time to buy Interactive Brokers? Find out by accessing our full research report, it’s free.
Interactive Brokers (IBKR) Q4 CY2025 Highlights:
- Volume: $4.04 million vs analyst estimates of $3.97 million (29.7% year-on-year growth, 2% beat)
- Revenue: $1.64 billion vs analyst estimates of $1.63 billion (15.4% year-on-year growth, 1.1% beat)
- Pre-tax Profit: $1.3 billion (79.1% margin)
- Adjusted EPS: $0.65 vs analyst estimates of $0.59 (11% beat)
- Market Capitalization: $32.67 billion
Company Overview
Founded in 1977 and known for its sophisticated trading technology and global reach across 150+ exchanges in 34 countries, Interactive Brokers (NASDAQ: IBKR) is a global electronic broker that provides low-cost trading and investment services across stocks, options, futures, forex, bonds, and other financial instruments.
Revenue Growth
A company’s long-term sales performance is one signal of its overall quality. Any business can have short-term success, but a top-tier one grows for years. Over the last five years, Interactive Brokers grew its revenue at an exceptional 22.7% compounded annual growth rate. Its growth beat the average financials company and shows its offerings resonate with customers.
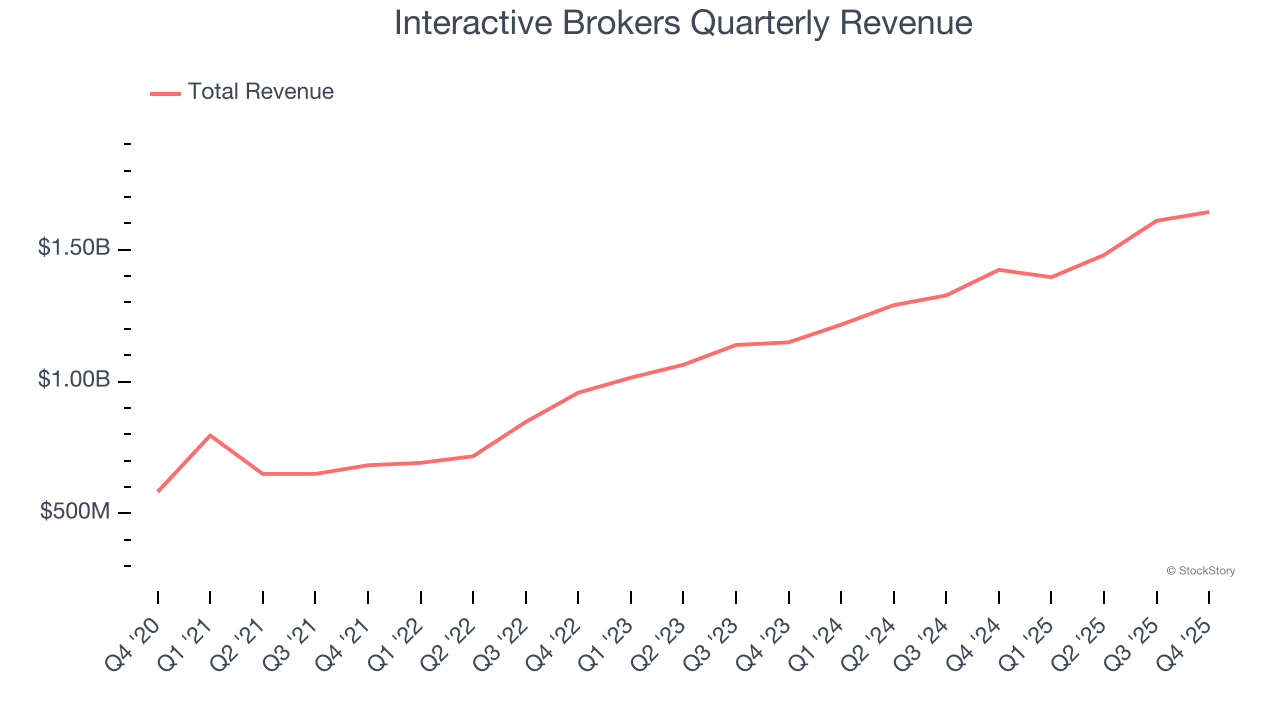
We at StockStory place the most emphasis on long-term growth, but within financials, a half-decade historical view may miss recent interest rate changes, market returns, and industry trends. Interactive Brokers’s annualized revenue growth of 18.5% over the last two years is below its five-year trend, but we still think the results suggest healthy demand. 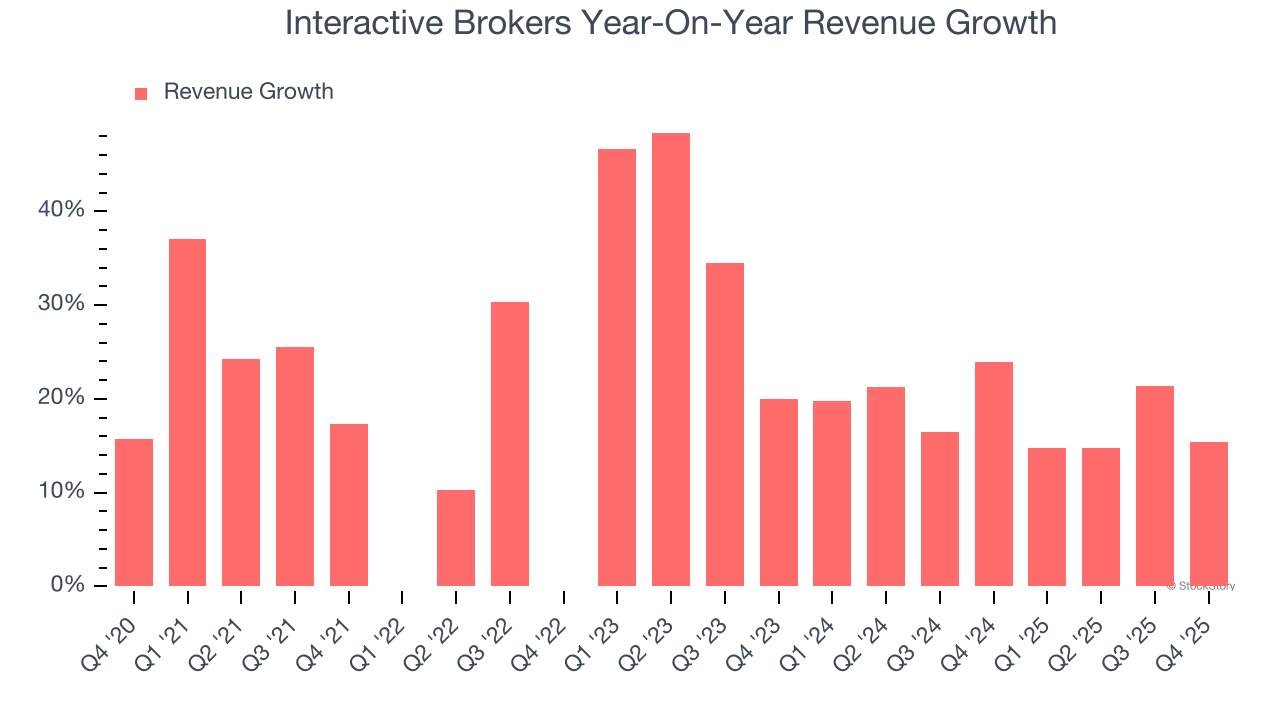 Note: Quarters not shown were determined to be outliers, impacted by outsized investment gains/losses that are not indicative of the recurring fundamentals of the business.
This quarter, Interactive Brokers reported year-on-year revenue growth of 15.4%, and its $1.64 billion of revenue exceeded Wall Street’s estimates by 1.1%.
Software is eating the world and there is virtually no industry left that has been untouched by it. That drives increasing demand for tools helping software developers do their jobs, whether it be monitoring critical cloud infrastructure, integrating audio and video functionality, or ensuring smooth content streaming. Click here to access a free report on our 3 favorite stocks to play this generational megatrend.
Volume
The total number of transactions and loan originations flowing through a firm is a key driver of top-line growth. Taken together, this volume is the lifeblood of financial services companies, whether traditional banks or fintech disruptors.
Interactive Brokers’s volumes have grown at an annual rate of 15.6% over the last five years, better than the broader financials industry but slower than its total revenue. When analyzing Interactive Brokers’s volumes over the last two years, we can see that growth accelerated to 37.8% annually.
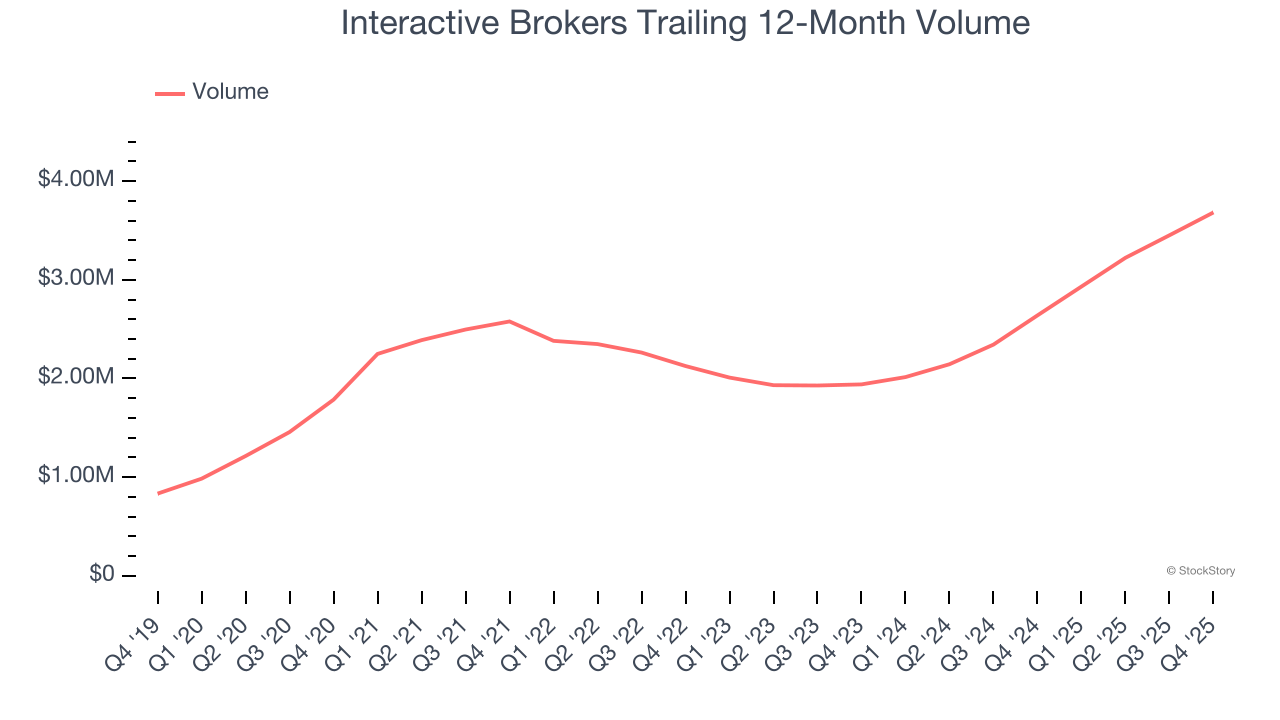
Interactive Brokers’s volumes punched in at $4.04 million this quarter, beating analysts’ expectations by 2%. This print was 29.7% higher than the same quarter last year.
Key Takeaways from Interactive Brokers’s Q4 Results
We enjoyed seeing Interactive Brokers beat analysts’ transaction volumes expectations this quarter. We were also glad its EPS outperformed Wall Street’s estimates. Overall, we think this was a solid quarter with some key areas of upside. Investors were likely hoping for more, and shares traded down 1.9% to $70.46 immediately following the results.
Is Interactive Brokers an attractive investment opportunity at the current price? We think that the latest quarter is only one piece of the longer-term business quality puzzle. Quality, when combined with valuation, can help determine if the stock is a buy. We cover that in our actionable full research report which you can read here (it’s free).


