
Global online betting powerhouse Flutter Entertainment (NASDAQ: FLUT) missed Wall Street’s revenue expectations in Q3 CY2025, but sales rose 16.8% year on year to $3.79 billion. Its GAAP loss of $3.92 per share was significantly below analysts’ consensus estimates.
Is now the time to buy Flutter Entertainment? Find out by accessing our full research report, it’s free for active Edge members.
Flutter Entertainment (FLUT) Q3 CY2025 Highlights:
- Revenue: $3.79 billion vs analyst estimates of $3.85 billion (16.8% year-on-year growth, 1.4% miss)
- EPS (GAAP): -$3.92 vs analyst estimates of -$0.65 (significant miss)
- Adjusted EBITDA: $478 million vs analyst estimates of $353.9 million (12.6% margin, 35.1% beat)
- Operating Margin: -22%, down from 3% in the same quarter last year
- Free Cash Flow Margin: 2.3%, down from 5% in the same quarter last year
- : 14.13 million, up 1.21 million year on year
- Market Capitalization: $38.05 billion
Company Overview
With its digital fingerprints on nearly every aspect of global gambling, from the Super Bowl bettor to the online poker aficionado, Flutter Entertainment (NASDAQ: FLUT) operates a portfolio of leading online sports betting and gaming brands including FanDuel, PokerStars, Paddy Power, and Sky Betting & Gaming.
Revenue Growth
A company’s long-term sales performance can indicate its overall quality. Any business can experience short-term success, but top-performing ones enjoy sustained growth for years. Over the last five years, Flutter Entertainment grew its sales at a 29.3% compounded annual growth rate. Although this growth is acceptable on an absolute basis, it fell slightly short of our standards for the consumer discretionary sector, which enjoys a number of secular tailwinds.
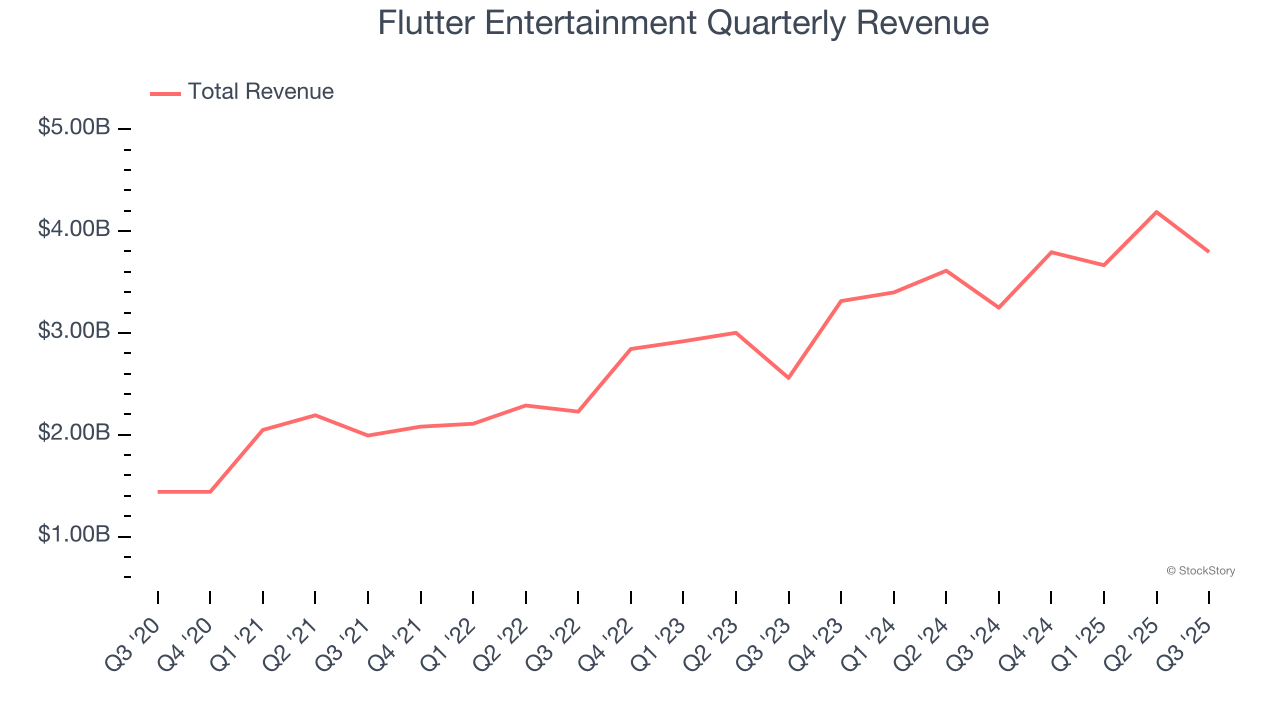
We at StockStory place the most emphasis on long-term growth, but within consumer discretionary, a stretched historical view may miss a company riding a successful new product or trend. Flutter Entertainment’s recent performance shows its demand has slowed as its annualized revenue growth of 16.8% over the last two years was below its five-year trend. Note that COVID hurt Flutter Entertainment’s business in 2020 and part of 2021, and it bounced back in a big way thereafter. 
This quarter, Flutter Entertainment’s revenue grew by 16.8% year on year to $3.79 billion but fell short of Wall Street’s estimates.
Looking ahead, sell-side analysts expect revenue to grow 20.7% over the next 12 months, an improvement versus the last two years. This projection is particularly healthy for a company of its scale and implies its newer products and services will catalyze better top-line performance.
The 1999 book Gorilla Game predicted Microsoft and Apple would dominate tech before it happened. Its thesis? Identify the platform winners early. Today, enterprise software companies embedding generative AI are becoming the new gorillas. a profitable, fast-growing enterprise software stock that is already riding the automation wave and looking to catch the generative AI next.
Operating Margin
Operating margin is a key measure of profitability. Think of it as net income - the bottom line - excluding the impact of taxes and interest on debt, which are less connected to business fundamentals.
Flutter Entertainment’s operating margin might fluctuated slightly over the last 12 months but has generally stayed the same. The company broke even over the last two years, inadequate for a consumer discretionary business. Its large expense base and inefficient cost structure were the main culprits behind this performance.
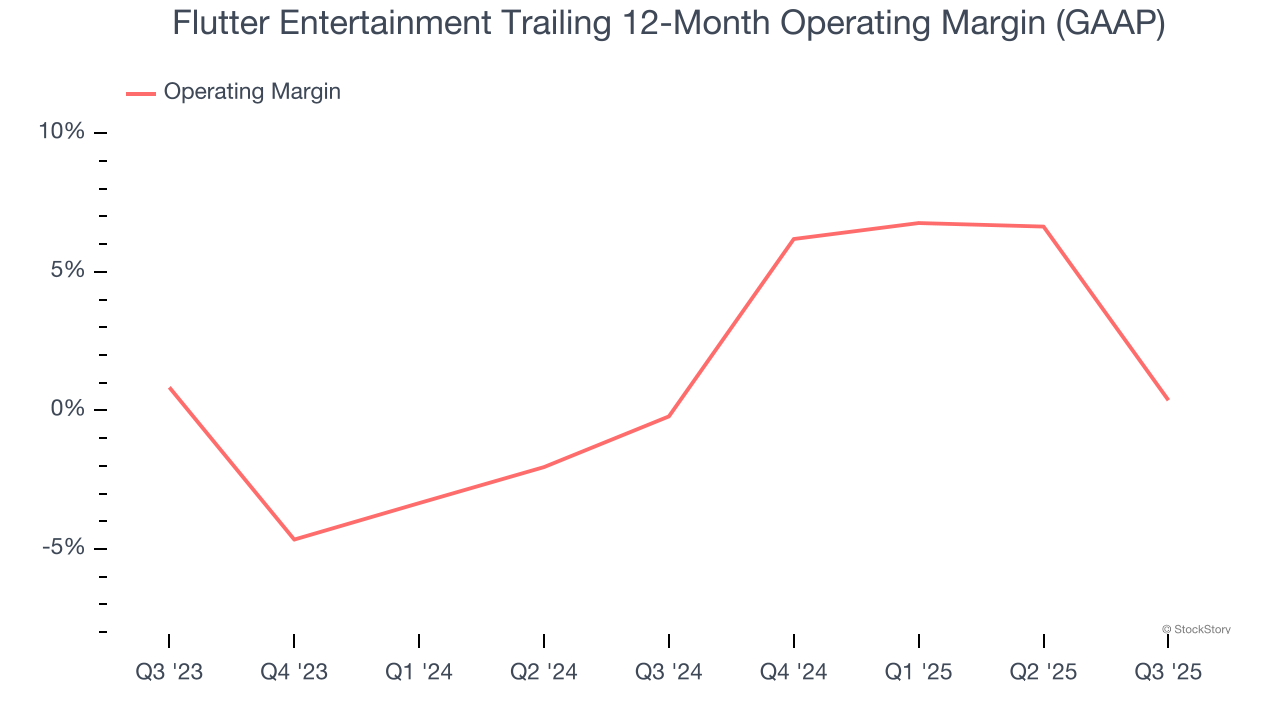
This quarter, Flutter Entertainment generated an operating margin profit margin of negative 22%, down 25 percentage points year on year. This contraction shows it was less efficient because its expenses grew faster than its revenue.
Earnings Per Share
Revenue trends explain a company’s historical growth, but the long-term change in earnings per share (EPS) points to the profitability of that growth – for example, a company could inflate its sales through excessive spending on advertising and promotions.
Although Flutter Entertainment’s full-year earnings are still negative, it reduced its losses and improved its EPS by 14% annually over the last four years. The next few quarters will be critical for assessing its long-term profitability.
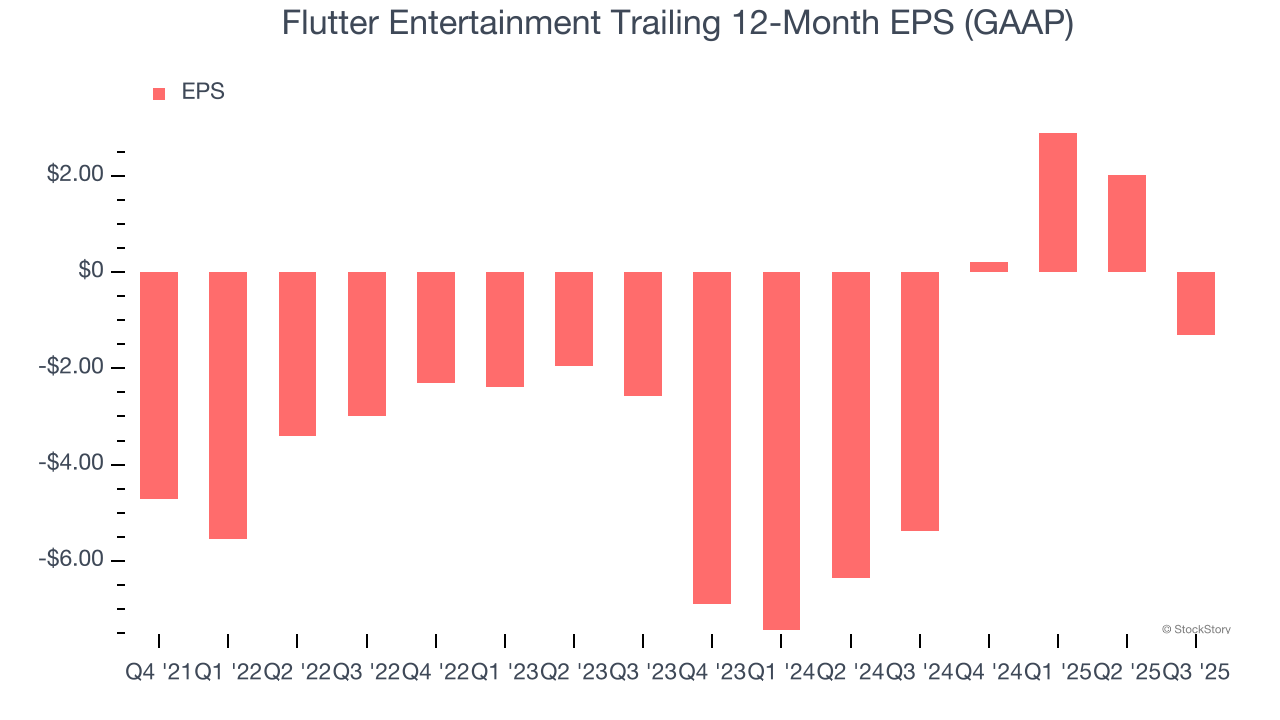
In Q3, Flutter Entertainment reported EPS of negative $3.92, down from negative $0.58 in the same quarter last year. This print missed analysts’ estimates. Over the next 12 months, Wall Street is optimistic. Analysts forecast Flutter Entertainment’s full-year EPS of negative $1.31 will flip to positive $4.46.
Key Takeaways from Flutter Entertainment’s Q3 Results
We were impressed by how significantly Flutter Entertainment blew past analysts’ EBITDA expectations this quarter. We were also excited its adjusted operating income outperformed Wall Street’s estimates by a wide margin. On the other hand, its EPS missed and its revenue fell slightly short of Wall Street’s estimates. Overall, this print was mixed but still had some key positives. The stock remained flat at $215.95 immediately after reporting.
Is Flutter Entertainment an attractive investment opportunity at the current price? We think that the latest quarter is only one piece of the longer-term business quality puzzle. Quality, when combined with valuation, can help determine if the stock is a buy. We cover that in our actionable full research report which you can read here, it’s free for active Edge members.