General contracting company Tutor Perini (NYSE: TPC) reported Q3 CY2025 results topping the market’s revenue expectations, with sales up 30.7% year on year to $1.42 billion. Its non-GAAP profit of $1.15 per share was 28.6% above analysts’ consensus estimates.
Is now the time to buy Tutor Perini? Find out by accessing our full research report, it’s free for active Edge members.
Tutor Perini (TPC) Q3 CY2025 Highlights:
- Revenue: $1.42 billion vs analyst estimates of $1.38 billion (30.7% year-on-year growth, 2.3% beat)
- Adjusted EPS: $1.15 vs analyst estimates of $0.89 (28.6% beat)
- Management raised its full-year Adjusted EPS guidance to $4.10 at the midpoint, a 7.9% increase
- Operating Margin: 2.8%, up from -9.8% in the same quarter last year
- Free Cash Flow Margin: 3.5%, up from 1.4% in the same quarter last year
- Backlog: $21.64 billion at quarter end, up 54.6% year on year
- Market Capitalization: $3.47 billion
Company Overview
Known for constructing the Philadelphia Eagles’ Stadium, Tutor Perini (NYSE: TPC) is a civil and building construction company offering diversified general contracting and design-build services.
Revenue Growth
A company’s long-term sales performance can indicate its overall quality. Any business can experience short-term success, but top-performing ones enjoy sustained growth for years. Unfortunately, Tutor Perini struggled to consistently increase demand as its $5.10 billion of sales for the trailing 12 months was close to its revenue five years ago. This was below our standards and is a tough starting point for our analysis.
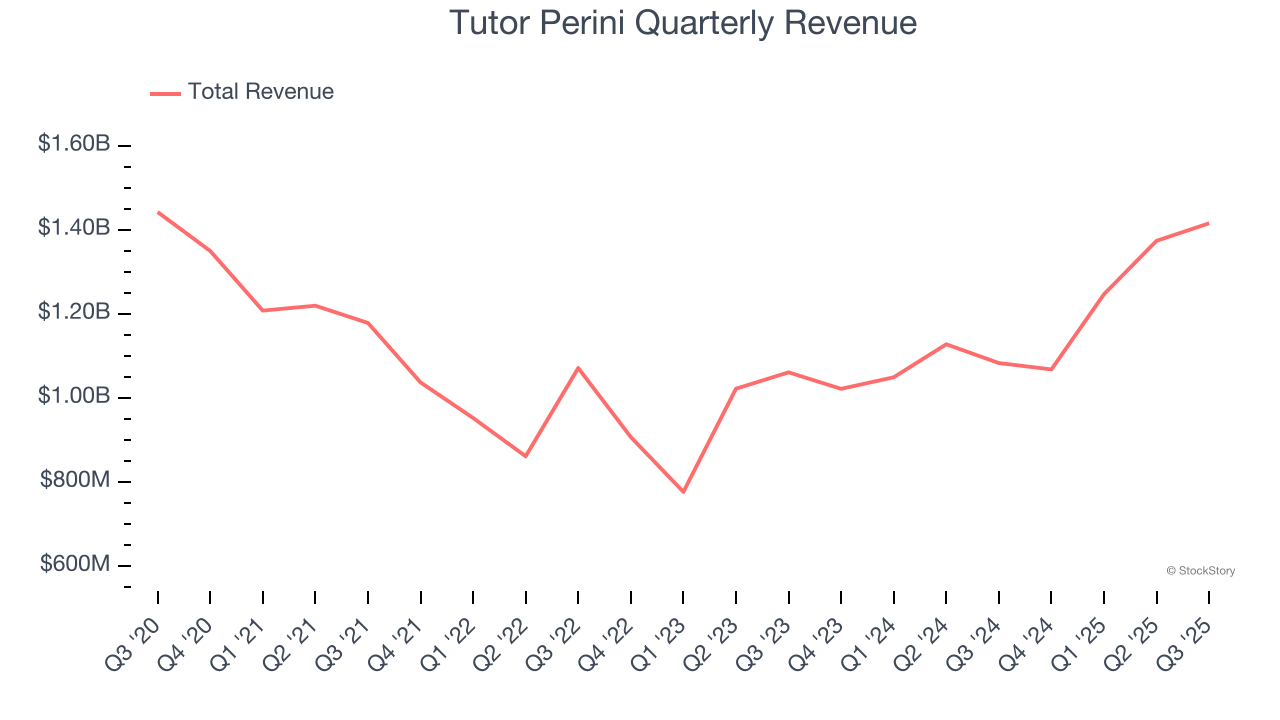
Long-term growth is the most important, but within industrials, a half-decade historical view may miss new industry trends or demand cycles. Tutor Perini’s annualized revenue growth of 16.4% over the last two years is above its five-year trend, suggesting its demand recently accelerated. 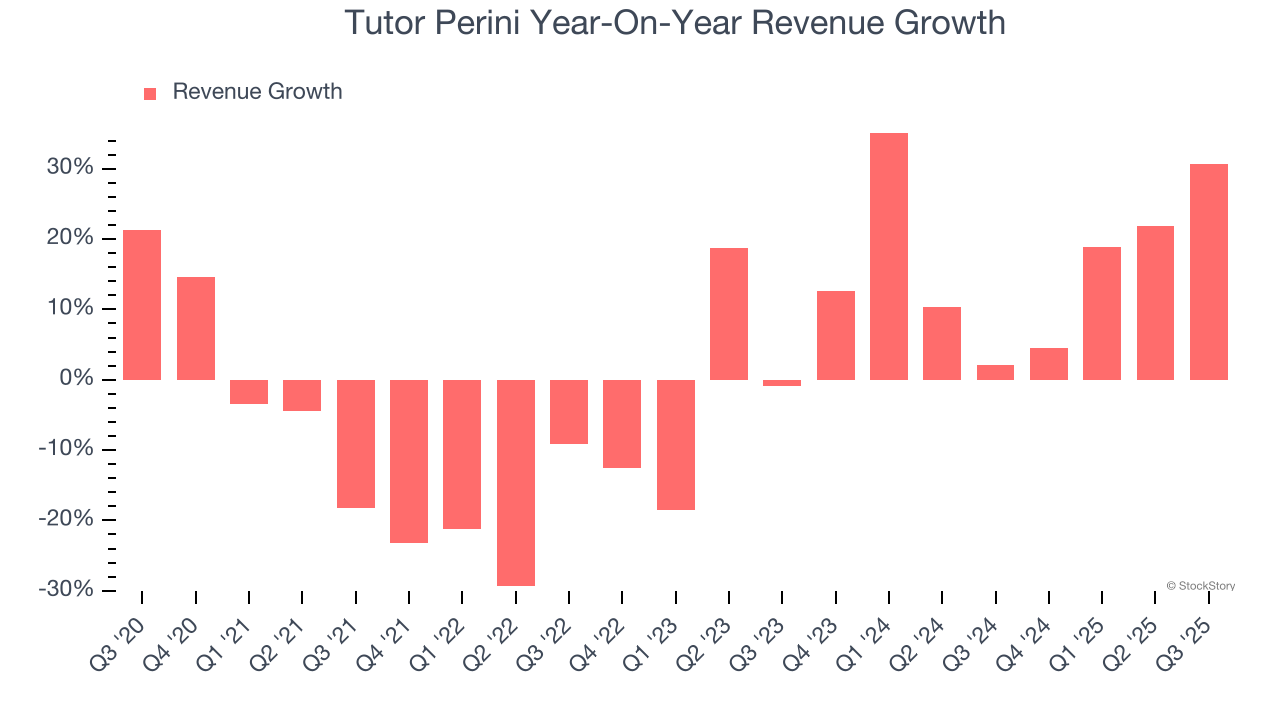
Tutor Perini also reports its backlog, or the value of its outstanding orders that have not yet been executed or delivered. Tutor Perini’s backlog reached $21.64 billion in the latest quarter and averaged 54.6% year-on-year growth over the last two years. Because this number is better than its revenue growth, we can see the company accumulated more orders than it could fulfill and deferred revenue to the future. This could imply elevated demand for Tutor Perini’s products and services but raises concerns about capacity constraints. 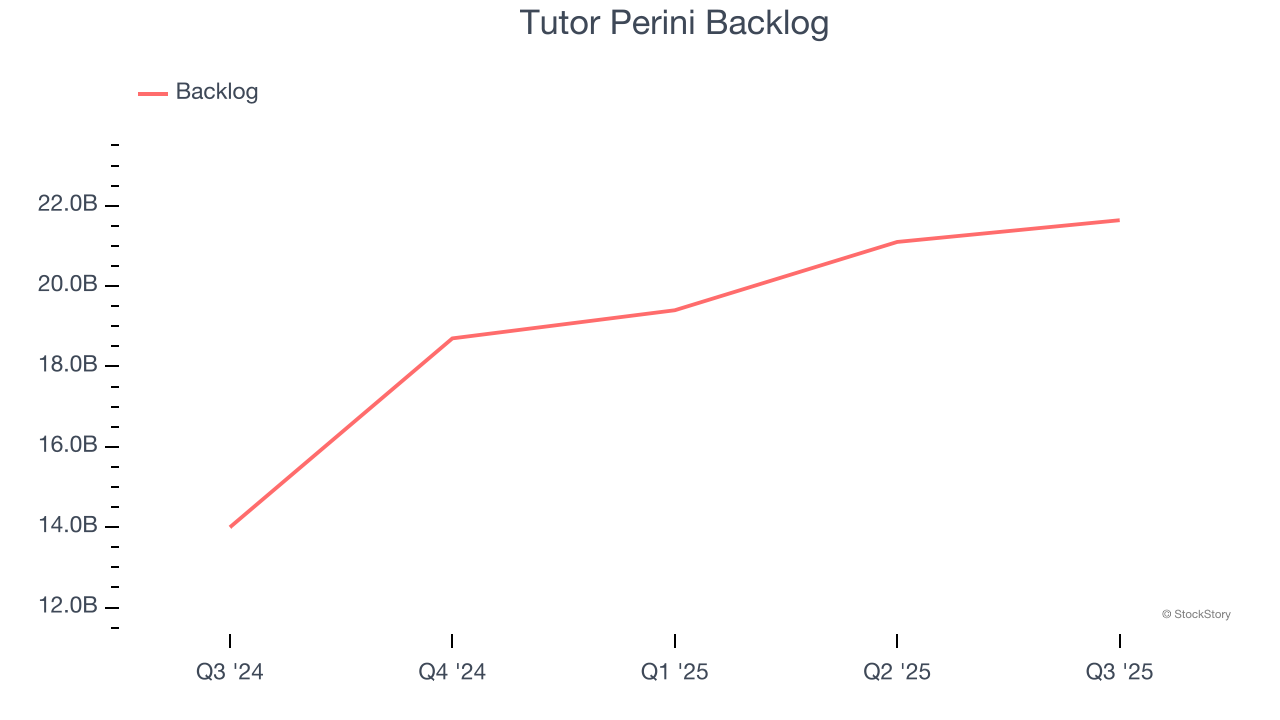
This quarter, Tutor Perini reported wonderful year-on-year revenue growth of 30.7%, and its $1.42 billion of revenue exceeded Wall Street’s estimates by 2.3%.
Looking ahead, sell-side analysts expect revenue to grow 15.1% over the next 12 months, similar to its two-year rate. Still, this projection is admirable and indicates the market sees success for its products and services.
The 1999 book Gorilla Game predicted Microsoft and Apple would dominate tech before it happened. Its thesis? Identify the platform winners early. Today, enterprise software companies embedding generative AI are becoming the new gorillas. a profitable, fast-growing enterprise software stock that is already riding the automation wave and looking to catch the generative AI next.
Operating Margin
Operating margin is a key measure of profitability. Think of it as net income - the bottom line - excluding the impact of taxes and interest on debt, which are less connected to business fundamentals.
Tutor Perini was roughly breakeven when averaging the last five years of quarterly operating profits, inadequate for an industrials business. This result isn’t too surprising given its low gross margin as a starting point.
Looking at the trend in its profitability, Tutor Perini’s operating margin decreased by 3.2 percentage points over the last five years. Tutor Perini’s performance was poor no matter how you look at it - it shows that costs were rising and it couldn’t pass them onto its customers.
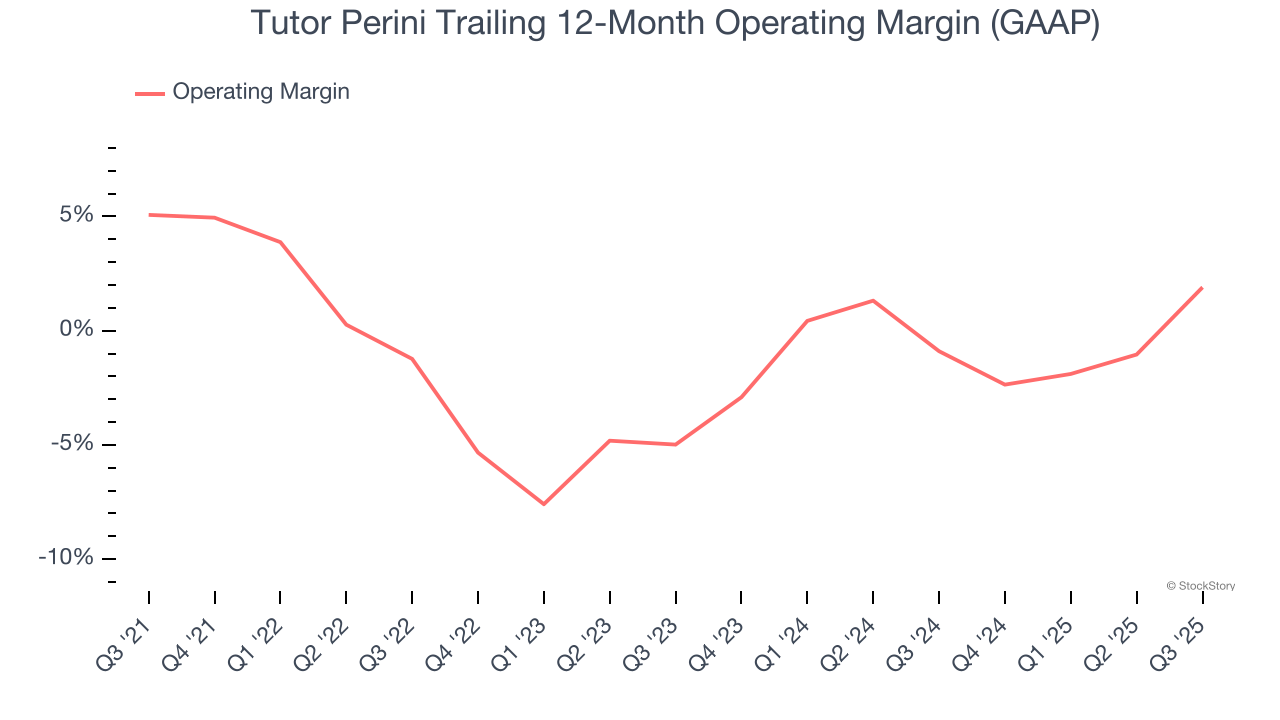
This quarter, Tutor Perini generated an operating margin profit margin of 2.8%, up 12.7 percentage points year on year. The increase was driven by stronger leverage on its cost of sales (not higher efficiency with its operating expenses), as indicated by its larger rise in gross margin.
Earnings Per Share
Revenue trends explain a company’s historical growth, but the long-term change in earnings per share (EPS) points to the profitability of that growth – for example, a company could inflate its sales through excessive spending on advertising and promotions.
Sadly for Tutor Perini, its EPS declined by 18.8% annually over the last five years while its revenue was flat. This tells us the company struggled because its fixed cost base made it difficult to adjust to choppy demand.
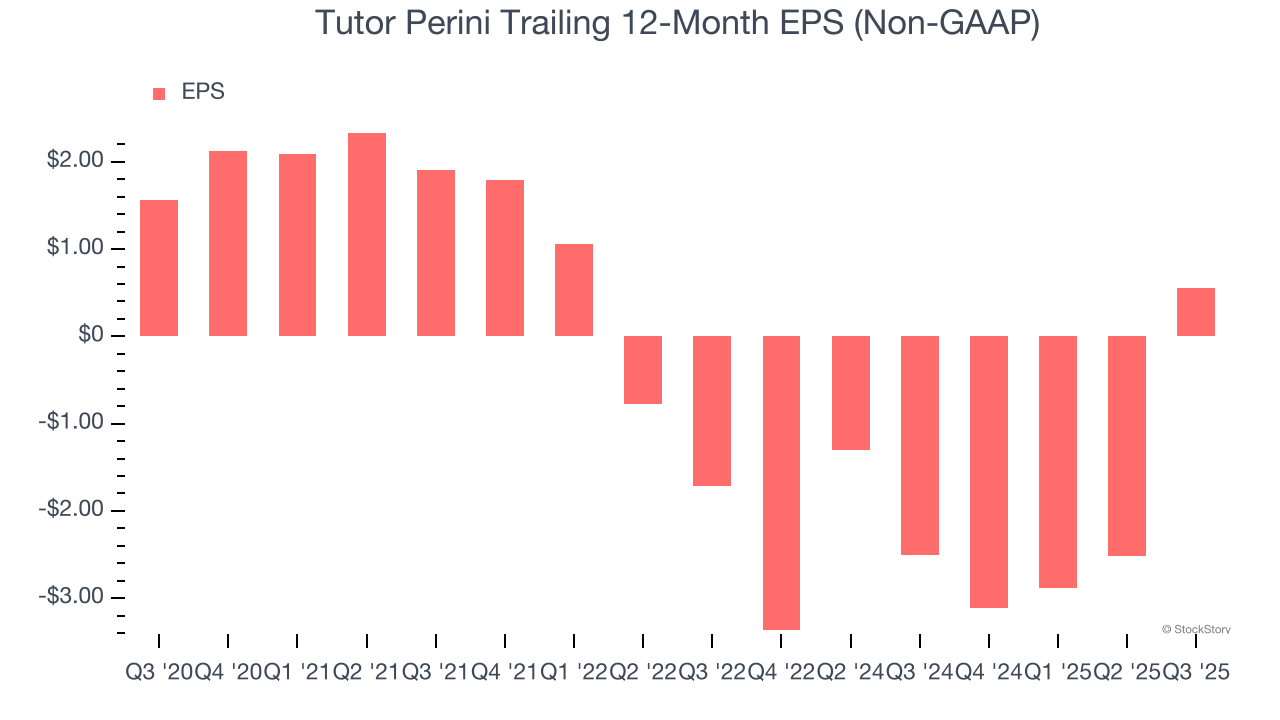
Diving into the nuances of Tutor Perini’s earnings can give us a better understanding of its performance. As we mentioned earlier, Tutor Perini’s operating margin expanded this quarter but declined by 3.2 percentage points over the last five years. Its share count also grew by 4.7%, meaning the company not only became less efficient with its operating expenses but also diluted its shareholders. 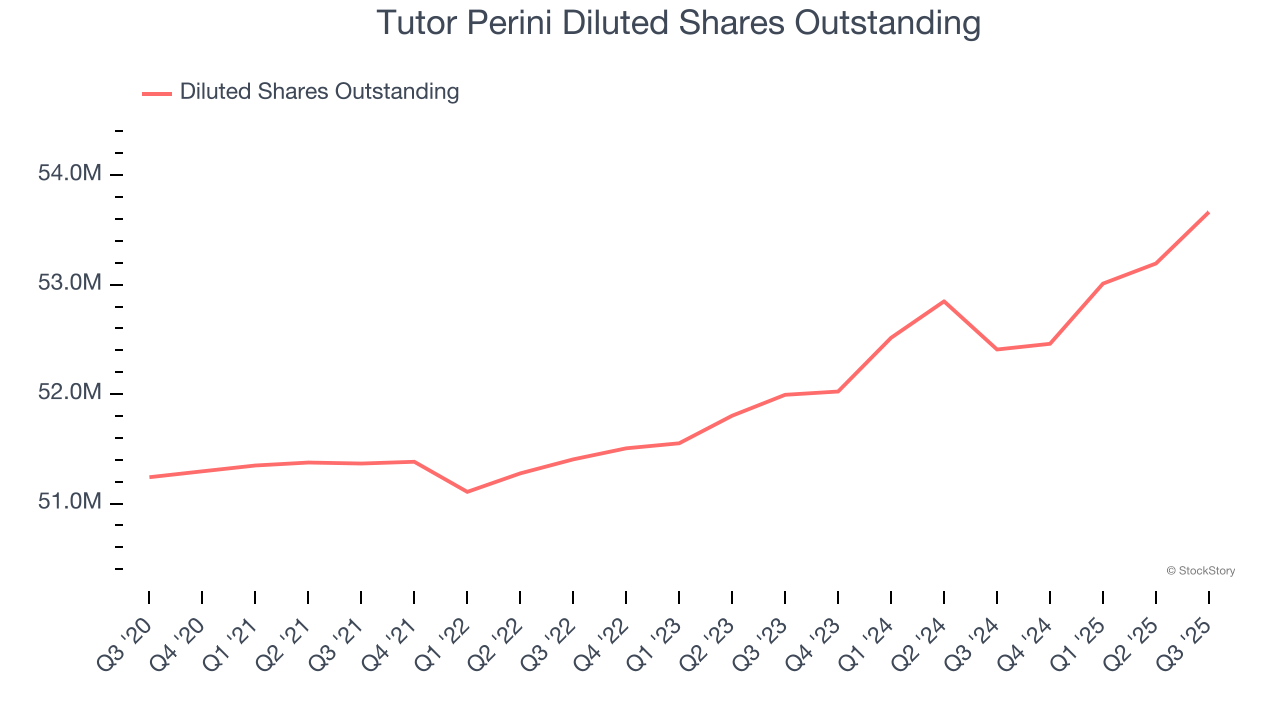
Like with revenue, we analyze EPS over a more recent period because it can provide insight into an emerging theme or development for the business.
For Tutor Perini, its two-year annual EPS growth of 55.2% was higher than its five-year trend. This acceleration made it one of the faster-growing industrials companies in recent history.
In Q3, Tutor Perini reported adjusted EPS of $1.15, up from negative $1.92 in the same quarter last year. This print easily cleared analysts’ estimates, and shareholders should be content with the results. Over the next 12 months, Wall Street expects Tutor Perini’s full-year EPS of $0.55 to grow 669%.
Key Takeaways from Tutor Perini’s Q3 Results
It was good to see Tutor Perini beat analysts’ EPS expectations this quarter. We were also glad its full-year EPS guidance trumped Wall Street’s estimates. Zooming out, we think this was a good print with some key areas of upside. The stock traded up 6.1% to $72 immediately after reporting.
Tutor Perini had an encouraging quarter, but one earnings result doesn’t necessarily make the stock a buy. Let’s see if this is a good investment. We think that the latest quarter is only one piece of the longer-term business quality puzzle. Quality, when combined with valuation, can help determine if the stock is a buy. We cover that in our actionable full research report which you can read here, it’s free for active Edge members.