


Footwear company Crocs (NASDAQ: CROX) reported Q3 CY2025 results exceeding the market’s revenue expectations, but sales fell by 6.2% year on year to $996.3 million. On top of that, next quarter’s revenue guidance ($1.07 billion at the midpoint) was surprisingly good and 15.8% above what analysts were expecting. Its non-GAAP profit of $2.92 per share was 23.7% above analysts’ consensus estimates.
Is now the time to buy Crocs? Find out by accessing our full research report, it’s free for active Edge members.
Crocs (CROX) Q3 CY2025 Highlights:
- Revenue: $996.3 million vs analyst estimates of $964.4 million (6.2% year-on-year decline, 3.3% beat)
- Adjusted EPS: $2.92 vs analyst estimates of $2.36 (23.7% beat)
- Adjusted EBITDA: $228 million vs analyst estimates of $200.4 million (22.9% margin, 13.8% beat)
- Revenue Guidance for Q4 CY2025 is $1.07 billion at the midpoint, above analyst estimates of $923 million
- Adjusted EPS guidance for Q4 CY2025 is $1.87 at the midpoint, above analyst estimates of $1.75
- Operating Margin: 20.8%, down from 25.4% in the same quarter last year
- Free Cash Flow Margin: 22.7%, down from 26.3% in the same quarter last year
- Constant Currency Revenue rose 1.2% year on year, in line with the same quarter last year
- Market Capitalization: $4.63 billion
Company Overview
Founded in 2002, Crocs (NASDAQ: CROX) sells casual footwear and is known for its iconic clog shoe.
Revenue Growth
Examining a company’s long-term performance can provide clues about its quality. Any business can put up a good quarter or two, but the best consistently grow over the long haul. Thankfully, Crocs’s 26.9% annualized revenue growth over the last five years was excellent. Its growth beat the average consumer discretionary company and shows its offerings resonate with customers.
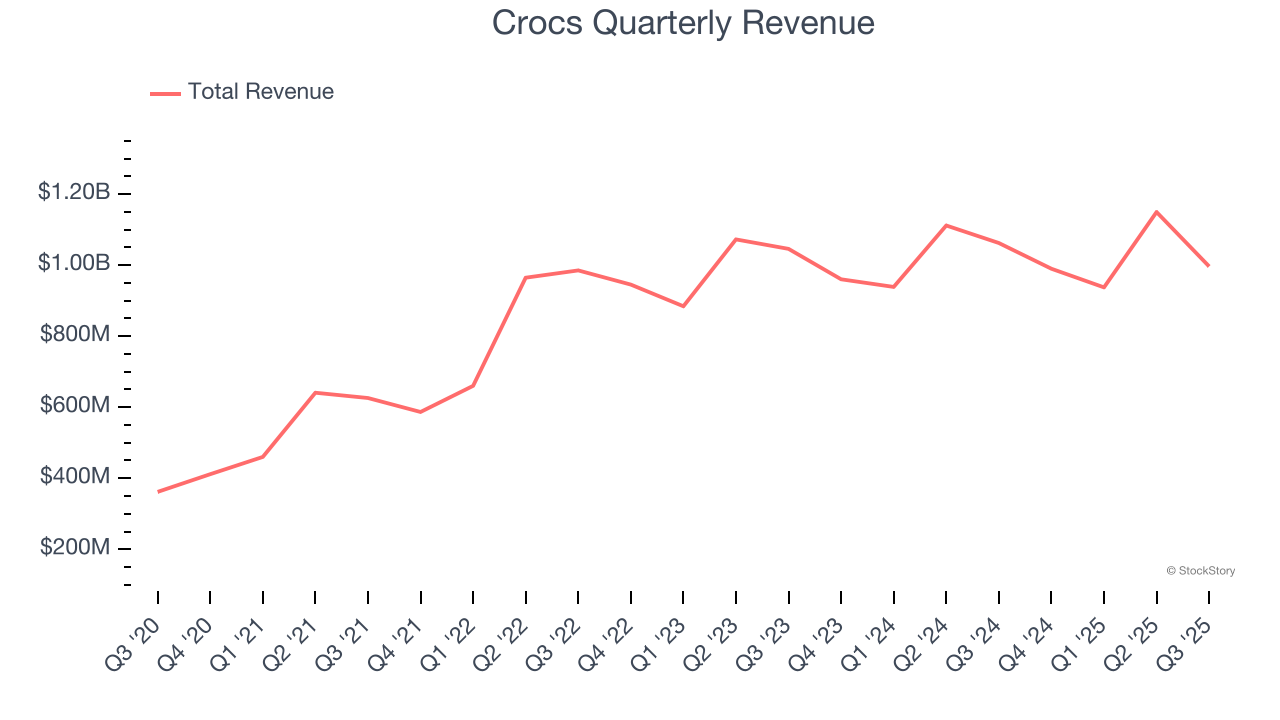
We at StockStory place the most emphasis on long-term growth, but within consumer discretionary, a stretched historical view may miss a company riding a successful new product or trend. Crocs’s recent performance shows its demand has slowed significantly as its annualized revenue growth of 1.6% over the last two years was well below its five-year trend. 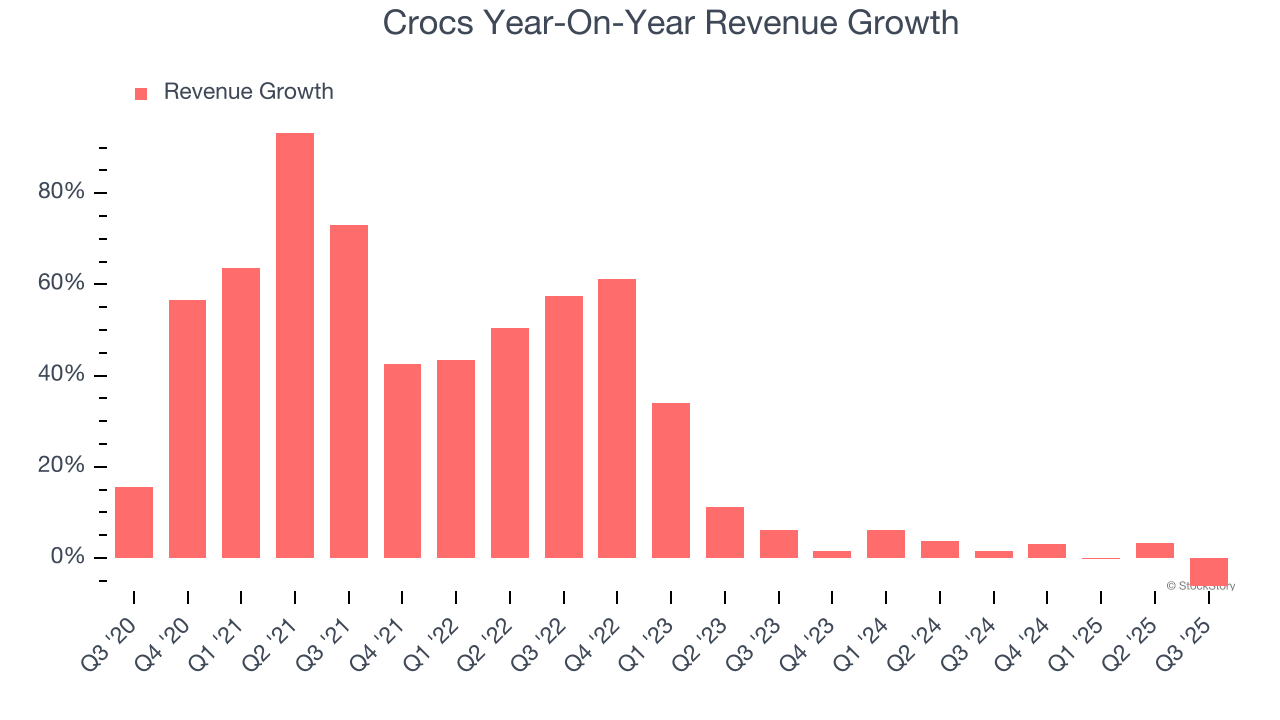
Crocs also reports sales performance excluding currency movements, which are outside the company’s control and not indicative of demand. Over the last two years, its constant currency sales averaged 3% year-on-year growth. Because this number aligns with its normal revenue growth, we can see that Crocs has properly hedged its foreign currency exposure. 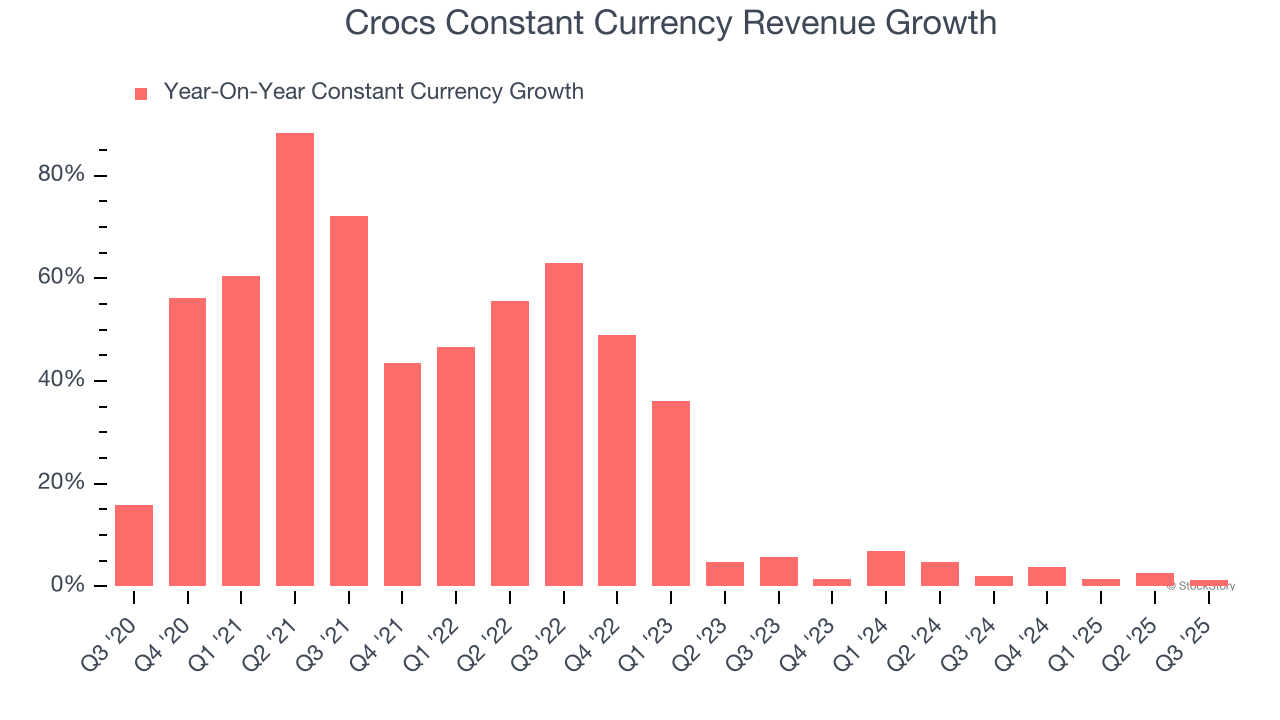
This quarter, Crocs’s revenue fell by 6.2% year on year to $996.3 million but beat Wall Street’s estimates by 3.3%. Company management is currently guiding for a 8% year-on-year increase in sales next quarter.
Looking further ahead, sell-side analysts expect revenue to decline by 2.3% over the next 12 months, a deceleration versus the last two years. This projection doesn't excite us and suggests its products and services will face some demand challenges.
Unless you’ve been living under a rock, it should be obvious by now that generative AI is going to have a huge impact on how large corporations do business. While Nvidia and AMD are trading close to all-time highs, we prefer a lesser-known (but still profitable) stock benefiting from the rise of AI. Click here to access our free report one of our favorites growth stories.
Operating Margin
Operating margin is a key measure of profitability. Think of it as net income - the bottom line - excluding the impact of taxes and interest on debt, which are less connected to business fundamentals.
Crocs’s operating margin has shrunk over the last 12 months, but it still averaged 15.2% over the last two years, solid for a consumer discretionary business. This shows it generally manages its expenses well, and its top-notch historical revenue growth also suggests its margin dropped because it ramped up investments to capture market share. We’ll keep a close eye to see if this strategy pays off.
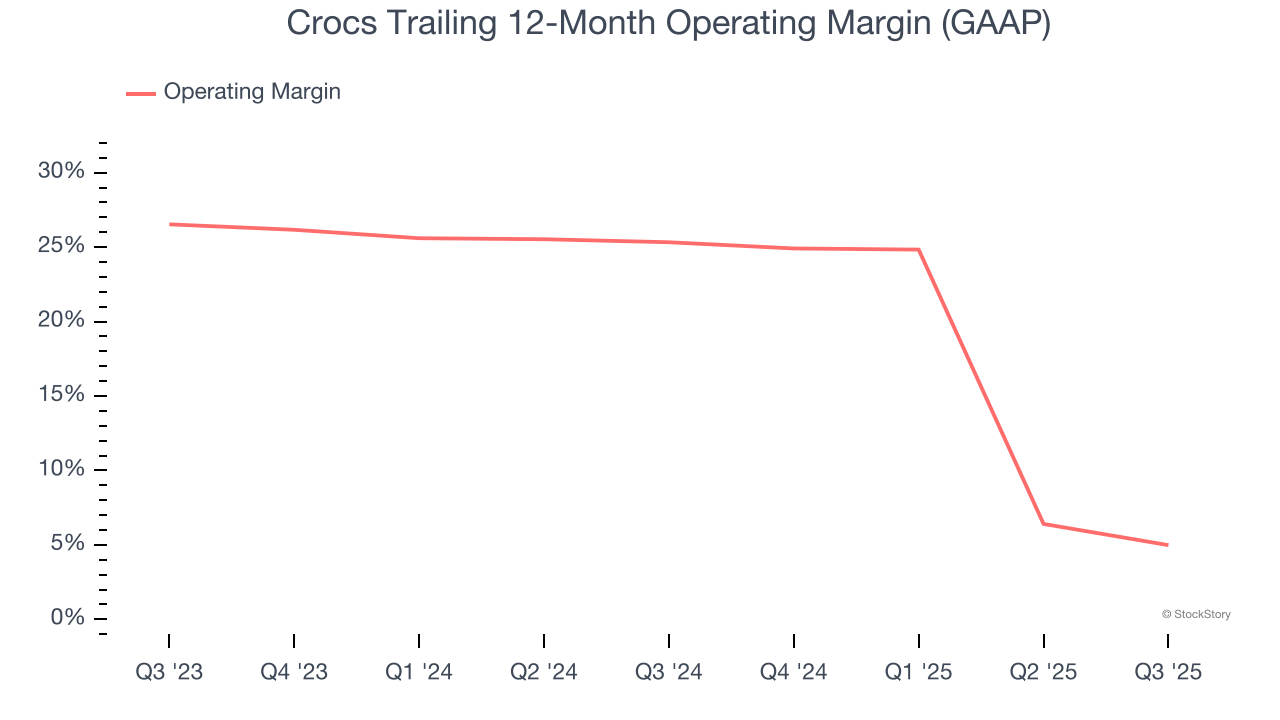
In Q3, Crocs generated an operating margin profit margin of 20.8%, down 4.6 percentage points year on year. This contraction shows it was less efficient because its expenses increased relative to its revenue.
Earnings Per Share
We track the long-term change in earnings per share (EPS) for the same reason as long-term revenue growth. Compared to revenue, however, EPS highlights whether a company’s growth is profitable.
Crocs’s EPS grew at an astounding 40.8% compounded annual growth rate over the last five years, higher than its 26.9% annualized revenue growth. However, this alone doesn’t tell us much about its business quality because its operating margin didn’t improve.
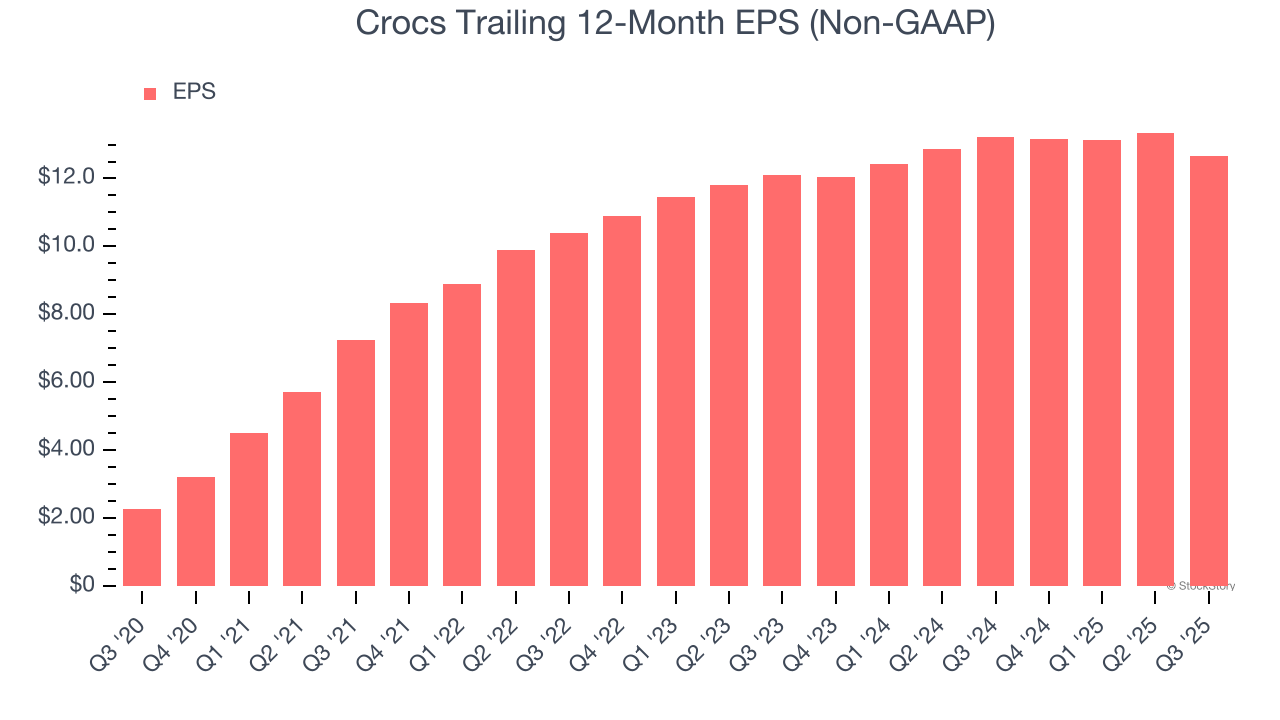
In Q3, Crocs reported adjusted EPS of $2.92, down from $3.60 in the same quarter last year. Despite falling year on year, this print easily cleared analysts’ estimates. Over the next 12 months, Wall Street expects Crocs’s full-year EPS of $12.67 to shrink by 16.2%.
Key Takeaways from Crocs’s Q3 Results
We were impressed by how significantly Crocs blew past analysts’ constant currency revenue expectations this quarter. We were also glad its EPS guidance for next quarter trumped Wall Street’s estimates. Zooming out, we think this quarter featured some important positives. The stock traded up 7.4% to $91.03 immediately following the results.
Crocs may have had a good quarter, but does that mean you should invest right now? If you’re making that decision, you should consider the bigger picture of valuation, business qualities, as well as the latest earnings. We cover that in our actionable full research report which you can read here, it’s free for active Edge members.


