Financial technology provider Broadridge (NYSE: BR) reported Q2 CY2026 results beating Wall Street’s revenue expectations, with sales up 7.5% year on year to $2.22 billion. Its non-GAAP profit of $3.82 per share was 1.7% above analysts’ consensus estimates.
Is now the time to buy Broadridge? Find out by accessing our full research report, it’s free.
Broadridge (BR) Q2 CY2026 Highlights:
- Revenue: $2.22 billion vs analyst estimates of $2.16 billion (7.5% year-on-year growth, 2.6% beat)
- Adjusted EPS: $3.82 vs analyst estimates of $3.76 (1.7% beat)
- Operating Margin: 24.6%, in line with the same quarter last year
- Free Cash Flow Margin: 28.9%, down from 32.1% in the same quarter last year
- Market Capitalization: $18.2 billion
"Broadridge is delivering strong results today while positioning our company for an exciting digital, agentic, and tokenized future," said Tim Gokey, Broadridge's CEO.
Company Overview
Processing over $10 trillion in equity and fixed income trades daily and managing proxy voting for over 800 million equity positions, Broadridge Financial Solutions (NYSE: BR) provides technology-driven solutions that power investing, governance, and communications for banks, broker-dealers, asset managers, and public companies.
Revenue Growth
A company’s long-term performance is an indicator of its overall quality. Any business can experience short-term success, but top-performing ones enjoy sustained growth for years.
With $7.48 billion in revenue over the past 12 months, Broadridge is one of the larger companies in the business services industry and benefits from a well-known brand that influences purchasing decisions.
As you can see below, Broadridge’s sales grew at a solid 8.4% compounded annual growth rate over the last five years. This is an encouraging starting point for our analysis because it shows Broadridge’s demand was higher than many business services companies.
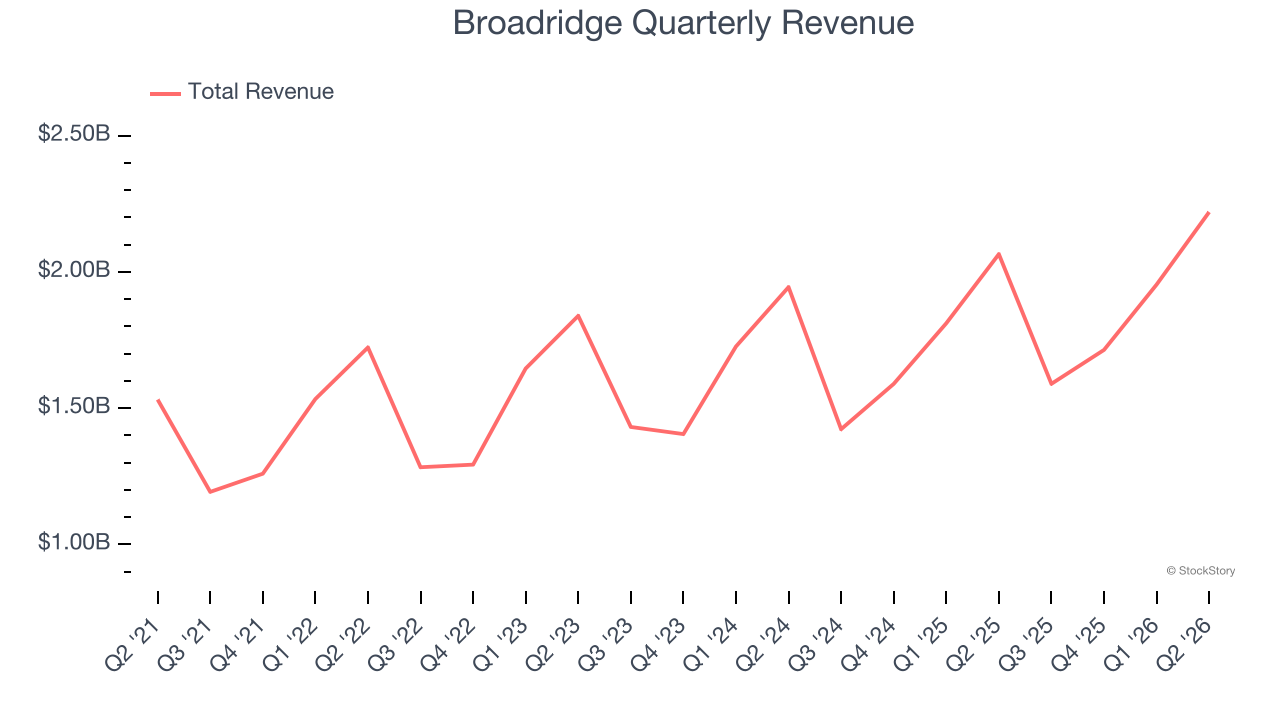
We at StockStory place the most emphasis on long-term growth, but within business services, a half-decade historical view may miss recent innovations or disruptive industry trends. Broadridge’s annualized revenue growth of 7.2% over the last two years is below its five-year trend, but we still think the results suggest healthy demand. 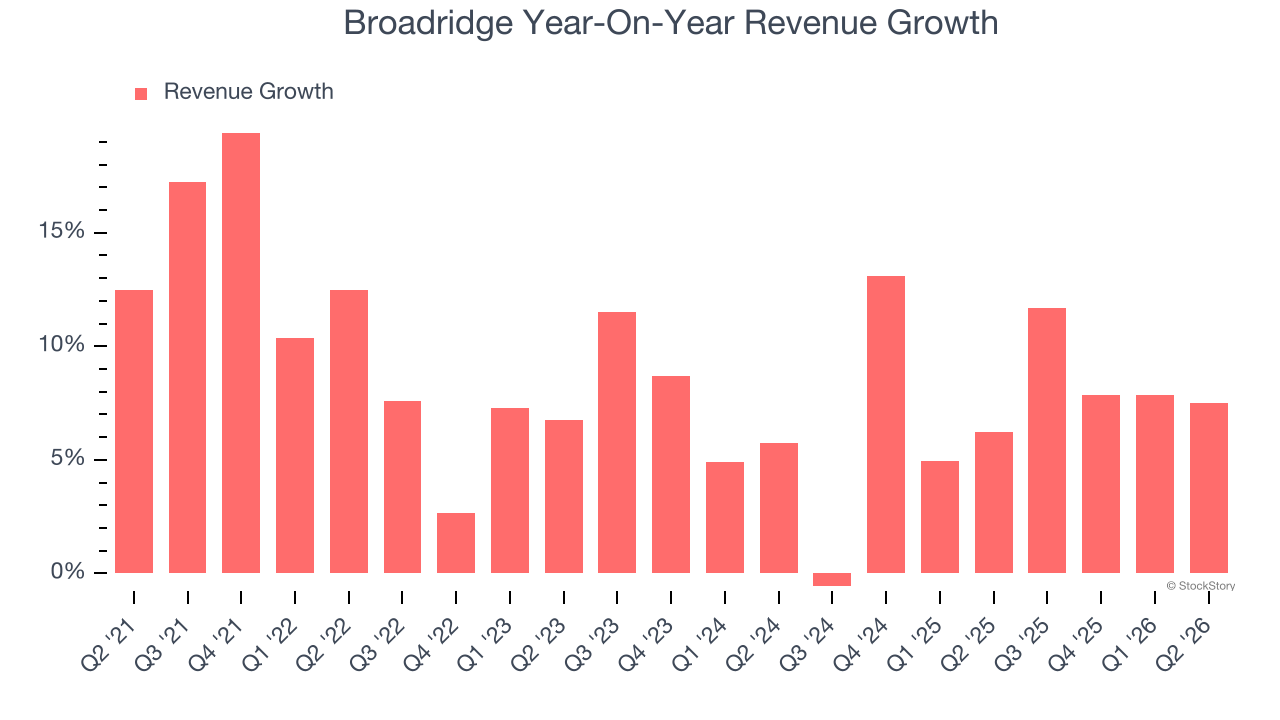
We can better understand the company’s revenue dynamics by analyzing its most important segment, Investor Communication Solutions. Over the last two years, Broadridge’s Investor Communication Solutions revenue (shareholder materials) averaged 7.3% year-on-year growth. 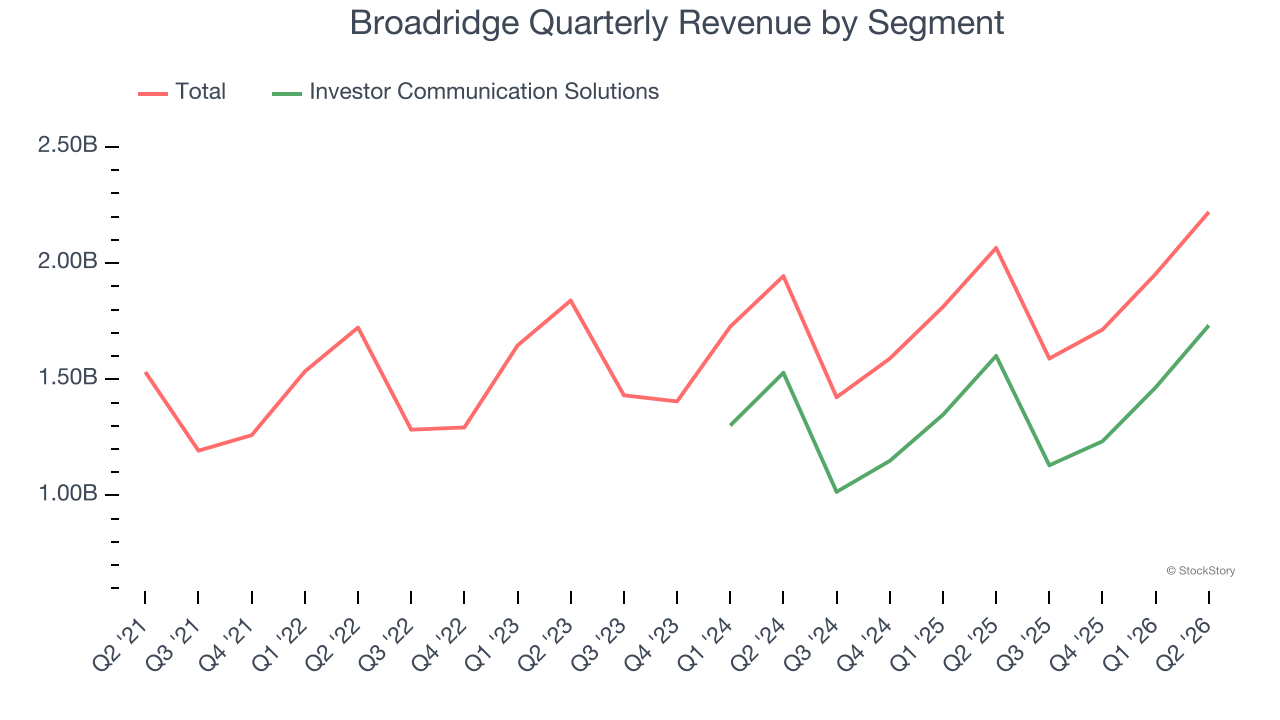
This quarter, Broadridge reported year-on-year revenue growth of 7.5%, and its $2.22 billion of revenue exceeded Wall Street’s estimates by 2.6%.
Looking ahead, sell-side analysts expect revenue to grow 3.7% over the next 12 months, a deceleration versus the last two years. This projection doesn’t excite us and implies its products and services will see some demand headwinds. At least the company is tracking well in other measures of financial health.
ONE MORE THING: 3 Hidden Platforms Growing 3X Faster than Amazon, Google, and PayPal. Amazon, Google, and Meta all followed the same playbook: Dominate an ignored market. Build an unbeatable moat. Scale until you’re unstoppable.
These three platforms are running that exact playbook right now. The early investors in Amazon made fortunes. The early investors in these could do the same. Get All 3 Stocks Here for FREE.
Adjusted Operating Margin
Adjusted operating margin is a key measure of profitability. Think of it as net income (the bottom line) excluding the impact of non-recurring expenses, taxes, and interest on debt - metrics less connected to business fundamentals.
Broadridge has been a well-oiled machine over the last five years. It demonstrated elite profitability for a business services business, boasting an average adjusted operating margin of 19.8%.
Analyzing the trend in its profitability, Broadridge’s adjusted operating margin rose by 1.2 percentage points over the last five years, as its sales growth gave it operating leverage.
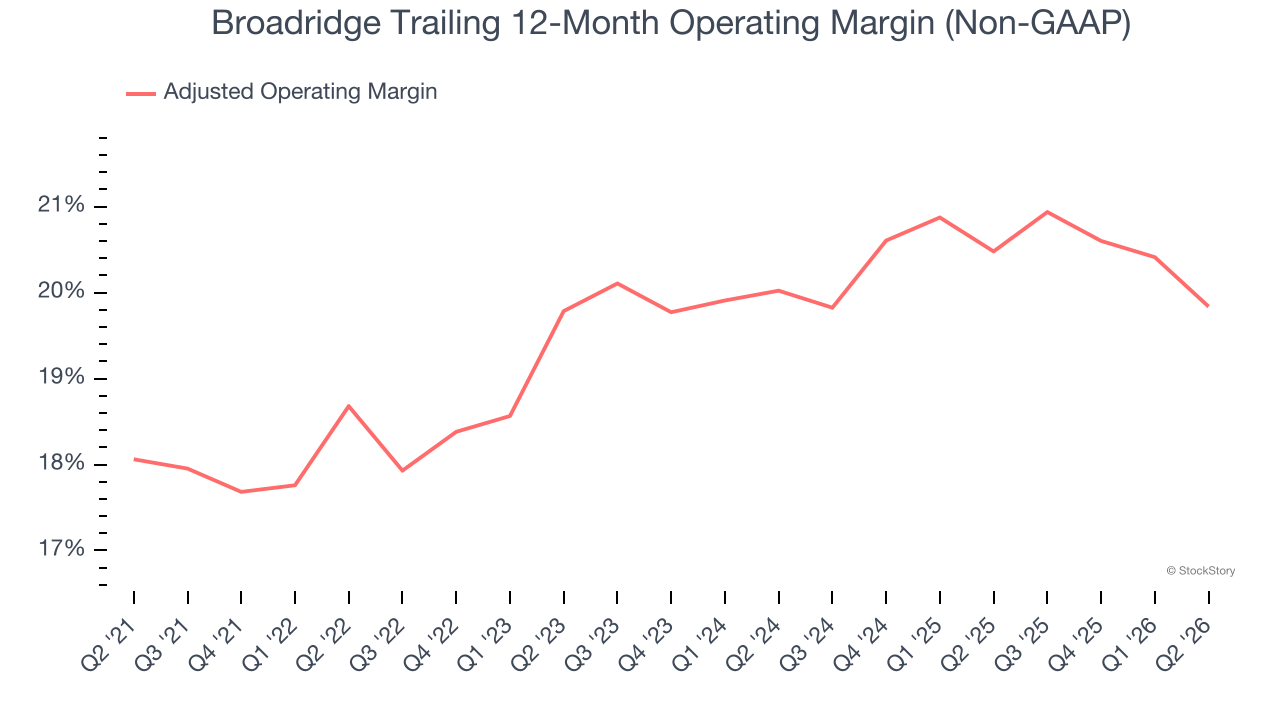
This quarter, Broadridge generated an adjusted operating margin profit margin of 24.6%, down 2.4 percentage points year on year. This contraction shows it was less efficient because its expenses grew faster than its revenue.
Earnings Per Share
We track the long-term change in earnings per share (EPS) for the same reason as long-term revenue growth. Compared to revenue, however, EPS highlights whether a company’s growth is profitable.
Broadridge’s EPS grew at 11.2% compounded annual growth rate over the last five years, higher than its 8.4% annualized revenue growth. This tells us the company became more profitable on a per-share basis as it expanded.
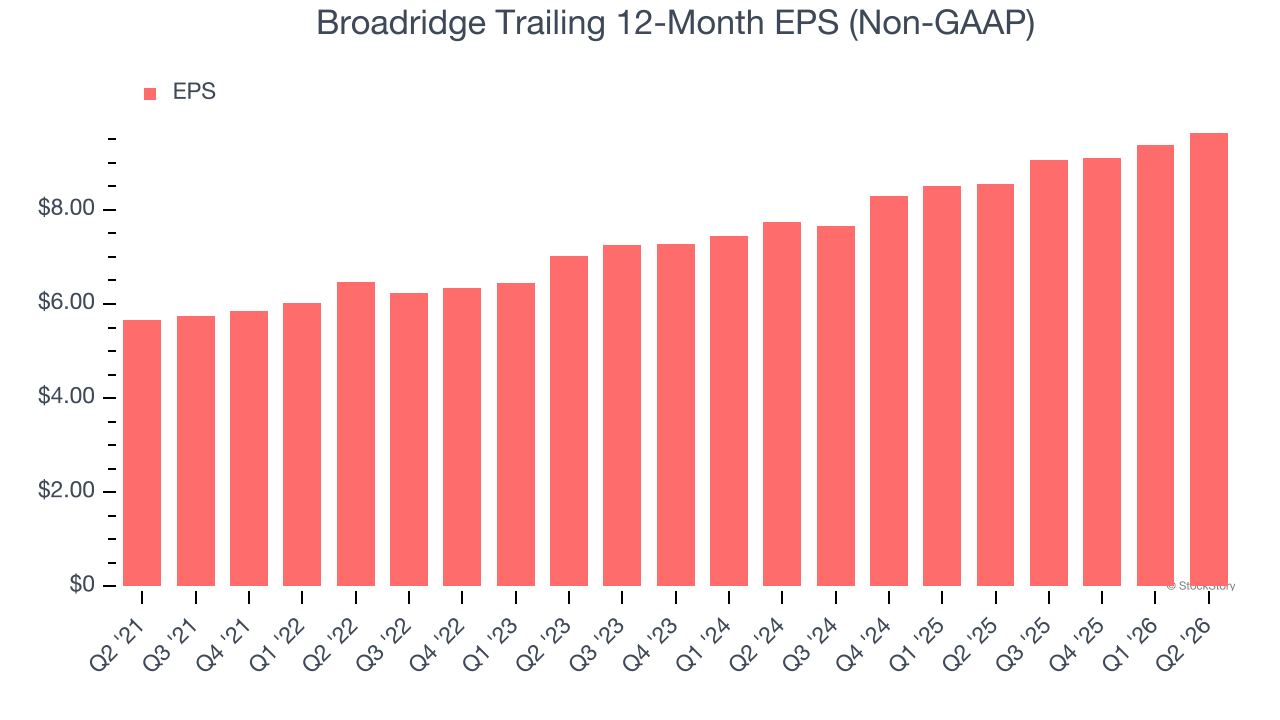
We can take a deeper look into Broadridge’s earnings to better understand the drivers of its performance. As we mentioned earlier, Broadridge’s adjusted operating margin declined this quarter but expanded by 1.2 percentage points over the last five years. Its share count also shrank by 2.1%, and these factors together are positive signs for shareholders because improving profitability and share buybacks turbocharge EPS growth relative to revenue growth. 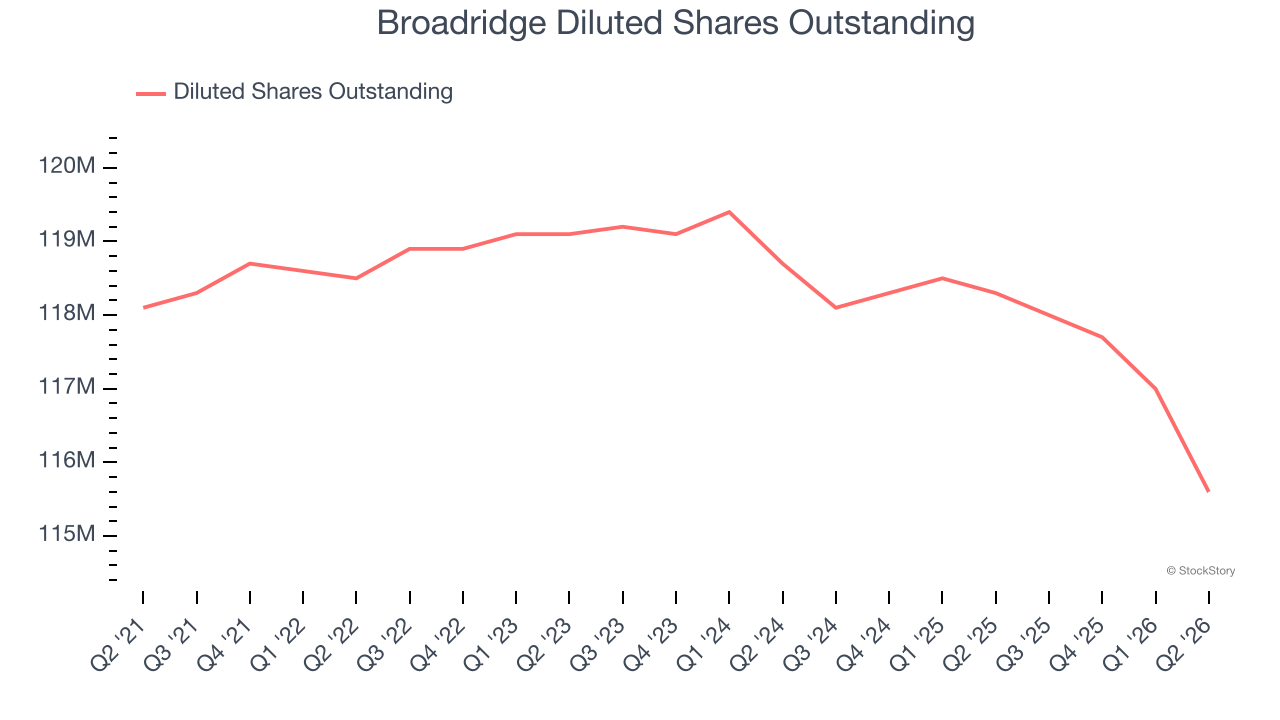
Like with revenue, we analyze EPS over a more recent period because it can provide insight into an emerging theme or development for the business.
For Broadridge, its two-year annual EPS growth of 11.6% is similar to its five-year trend, implying stable earnings power.
In Q2, Broadridge reported adjusted EPS of $3.82, up from $3.55 in the same quarter last year. This print beat analysts’ estimates by 1.7%. Over the next 12 months, Wall Street expects Broadridge’s full-year EPS to grow 7.6% from $9.64 to $10.38.
Key Takeaways from Broadridge’s Q2 Results
We enjoyed seeing Broadridge beat analysts’ revenue expectations this quarter. We were also glad its EPS outperformed Wall Street’s estimates. Overall, this print had some key positives. The stock traded up 1.4% to $159.56 immediately after reporting.
Indeed, Broadridge had a rock-solid quarterly earnings result, but is this stock a good investment here? If you’re making that decision, you should consider the bigger picture of valuation, business qualities, as well as the latest earnings. We cover that in our actionable full research report which you can read here (it’s free).