Insurance and financial services company The Hartford (NYSE: HIG) met Wall Street’s revenue expectations in Q2 CY2026, with sales up 4% year on year to $7.26 billion. Its non-GAAP profit of $3.42 per share was 8.9% above analysts’ consensus estimates.
Is now the time to buy Hartford? Find out by accessing our full research report, it’s free.
Hartford (HIG) Q2 CY2026 Highlights:
- Net Premiums Earned: $4.57 billion vs analyst estimates of $4.58 billion (in line)
- Revenue: $7.26 billion vs analyst estimates of $7.24 billion (4% year-on-year growth, in line)
- Combined Ratio: 91.2% vs analyst estimates of 92.4% (115 basis point beat)
- Adjusted EPS: $3.42 vs analyst estimates of $3.14 (8.9% beat)
- Book Value per Share: $79.79 vs analyst estimates of $77.37 (3.1% beat)
- Market Capitalization: $38.61 billion
Company Overview
Recognizable by its iconic stag logo that dates back to 1810, The Hartford (NYSE: HIG) provides property and casualty insurance, group benefits, and investment products to individuals and businesses across the United States.
Revenue Growth
Insurance companies earn revenue from three primary sources: 1) The core insurance business itself, often called underwriting and represented in the income statement as premiums 2) Income from investing the “float” (premiums collected upfront not yet paid out as claims) in assets such as fixed-income assets and equities 3) Fees from various sources such as policy administration, annuities, or other value-added services. Unfortunately, Hartford’s 6.4% annualized revenue growth over the last five years was mediocre. This fell short of our benchmark for the insurance sector and is a rough starting point for our analysis.
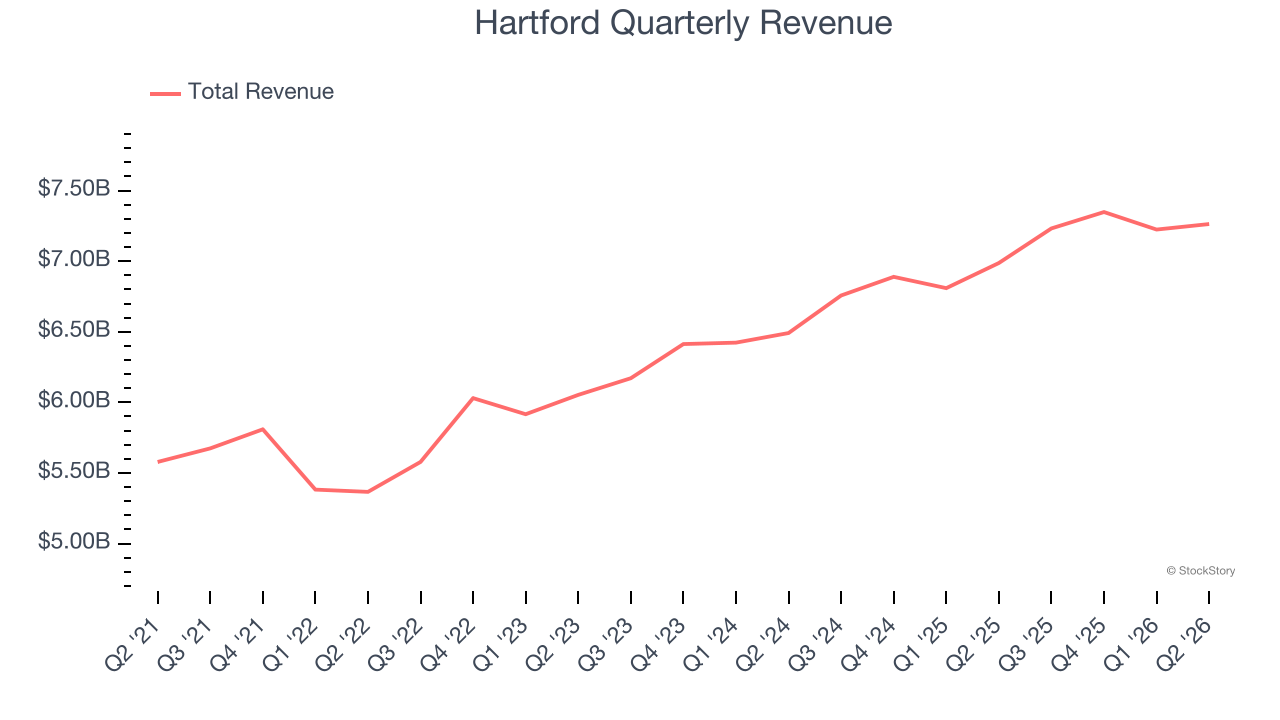
We at StockStory place the most emphasis on long-term growth, but within financials, a half-decade historical view may miss recent interest rate changes, market returns, and industry trends. Hartford’s annualized revenue growth of 6.8% over the last two years aligns with its five-year trend, suggesting its demand was consistently weak. 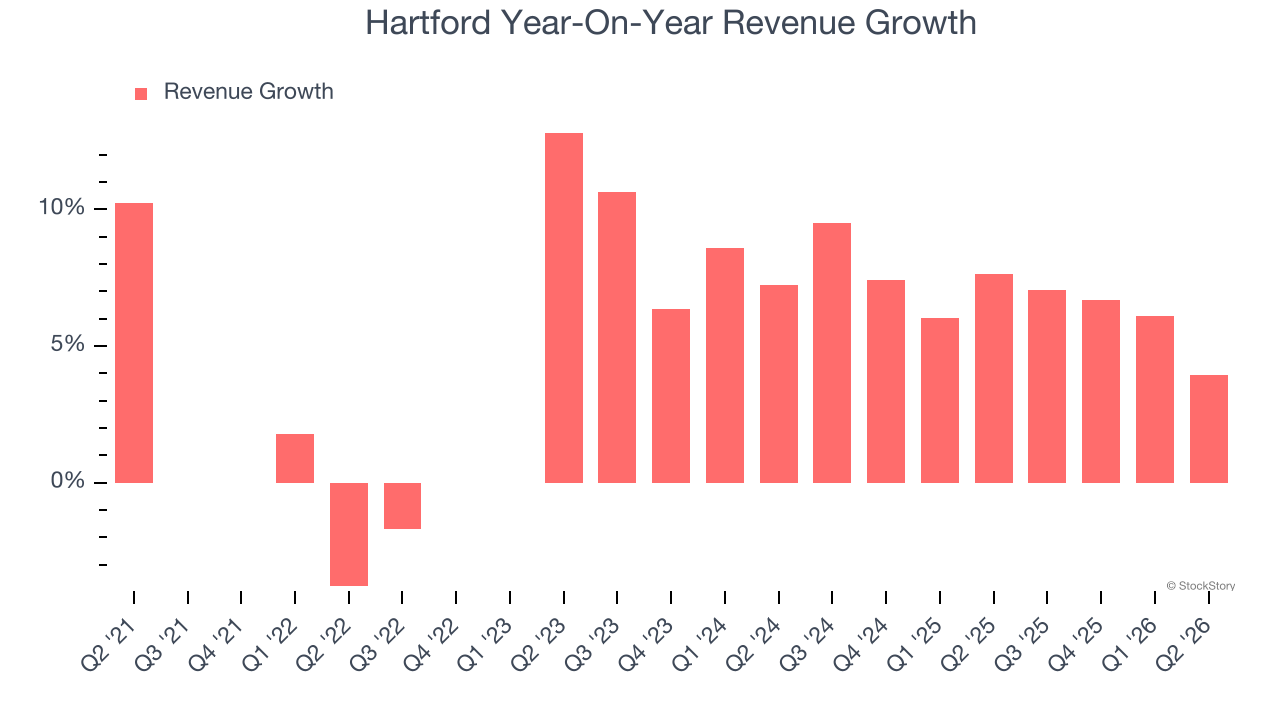 Note: Quarters not shown were determined to be outliers because they were impacted by outsized investment gains/losses that are not indicative of the recurring fundamentals of the business.
This quarter, Hartford grew its revenue by 4% year on year, and its $7.26 billion of revenue was in line with Wall Street’s estimates.
Net premiums earned made up 88.8% of the company’s total revenue during the last five years, meaning Hartford barely relies on non-insurance activities to drive its overall growth.
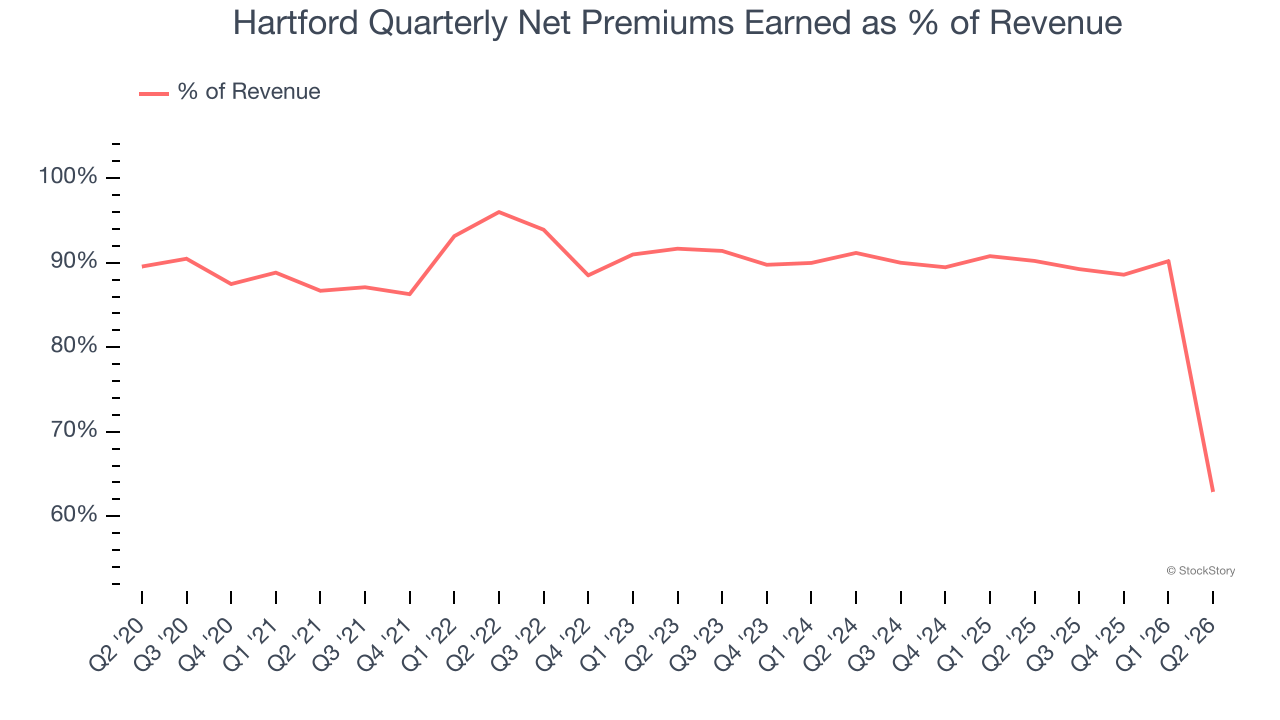
While insurers generate revenue from multiple sources, investors view net premiums earned as the cornerstone — their direct link to core operations stands in sharp contrast to the unpredictability of investment returns and fees.
ONE MORE THING: 3 Hidden Platforms Growing 3X Faster than Amazon, Google, and PayPal. Amazon, Google, and Meta all followed the same playbook: Dominate an ignored market. Build an unbeatable moat. Scale until you’re unstoppable.
These three platforms are running that exact playbook right now. The early investors in Amazon made fortunes. The early investors in these could do the same. Get All 3 Stocks Here for FREE.
Book Value Per Share (BVPS)
Insurance companies are balance sheet businesses, collecting premiums upfront and paying out claims over time. The float — premiums collected but not yet paid out — is invested, creating an asset base supported by a liability structure. Book value captures this dynamic by measuring:
- Assets (investment portfolio, cash, reinsurance recoverables) - liabilities (claim reserves, debt, future policy benefits)
BVPS is essentially the residual value for shareholders.
We therefore consider BVPS very important to track for insurers and a metric that sheds light on business quality because it reflects long-term capital growth and is harder to manipulate than more commonly-used metrics like EPS.
Hartford’s BVPS grew at a solid 9.2% annual clip over the last five years. BVPS growth has also accelerated recently, growing by 23.6% annually over the last two years from $52.20 to $79.79 per share.
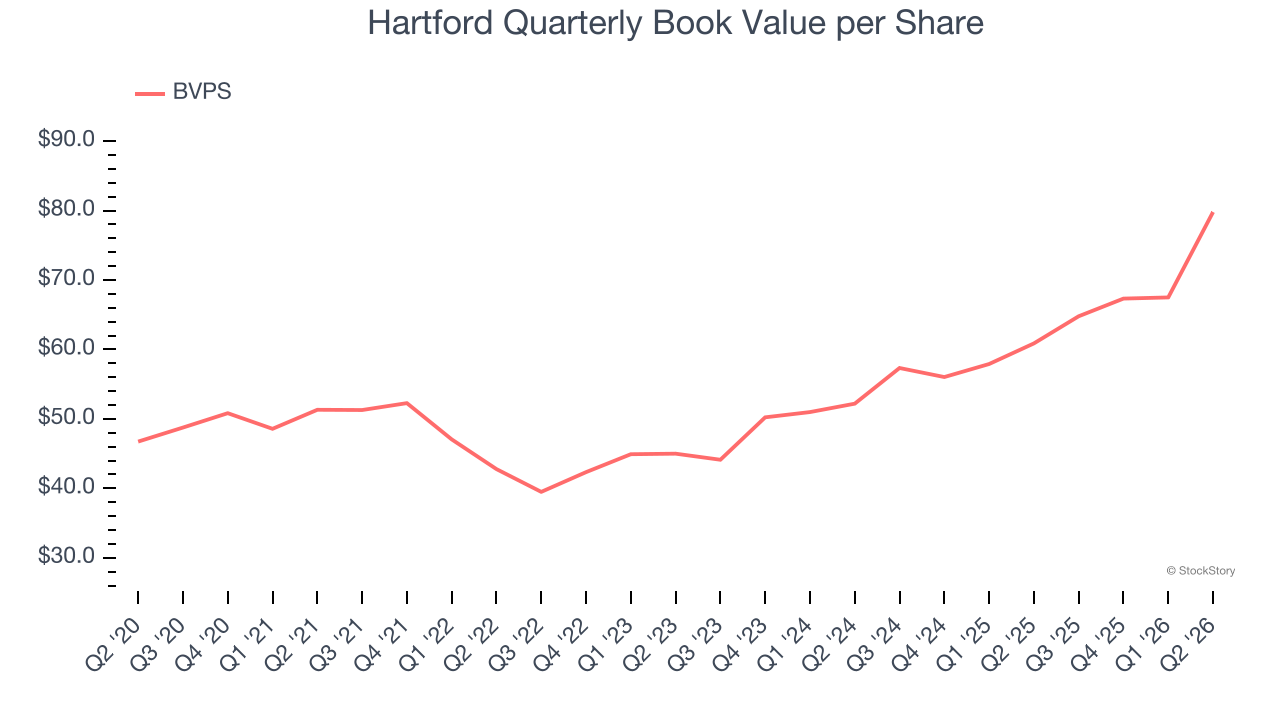
Over the next 12 months, Consensus estimates call for Hartford’s BVPS to grow by 6.9% to $77.37, paltry growth rate.
Key Takeaways from Hartford’s Q2 Results
We enjoyed seeing Hartford beat analysts’ book value per share expectations this quarter. We were also glad its EPS outperformed Wall Street’s estimates. On the other hand, its net premiums earned was in line. Overall, this print had some key positives. The market seemed to be hoping for more, and the stock traded down 2% to $139.50 immediately after reporting.
So should you invest in Hartford right now? We think that the latest quarter is only one piece of the longer-term business quality puzzle. Quality, when combined with valuation, can help determine if the stock is a buy. We cover that in our actionable full research report which you can read here (it’s free).