Cruise ship company Carnival (NYSE: CCL) beat Wall Street’s revenue expectations in Q1 CY2026, with sales up 6.1% year on year to $6.17 billion. Its non-GAAP profit of $0.20 per share was 8.9% above analysts’ consensus estimates.
Is now the time to buy Carnival? Find out by accessing our full research report, it’s free.
Carnival (CCL) Q1 CY2026 Highlights:
- Revenue: $6.17 billion vs analyst estimates of $6.13 billion (6.1% year-on-year growth, beat)
- Adjusted EPS: $0.20 vs analyst estimates of $0.18 (8.9% beat)
- Adjusted EBITDA: $1.27 billion vs analyst estimates of $1.26 billion (20.6% margin, in line)
- Management lowered its full-year Adjusted EPS guidance to $2.21 at the midpoint, a 10.9% decrease
- EBITDA guidance for the full year is $7.19 billion at the midpoint, below analyst estimates of $7.48 billion
- Operating Margin: 9.8%, in line with the same quarter last year
- Free Cash Flow Margin: 11.3%, up from 5.5% in the same quarter last year
- Passenger Cruise Days: in line with the same quarter last year
- Market Capitalization: $35.02 billion
"We delivered a strong start to the year, with record first-quarter operating results that exceeded our guidance, driven by healthy fundamentals and solid execution across the business. This performance supported an increase to our full year operational outlook of nearly $150 million, helping to mitigate the impact of higher fuel prices," said Carnival Corporation & plc's Chief Executive Officer Josh Weinstein.
Company Overview
Boasting outrageous amenities like a planetarium on board its ships, Carnival (NYSE: CCL) is one of the world's largest leisure travel companies and a prominent player in the cruise industry.
Revenue Growth
Reviewing a company’s long-term sales performance reveals insights into its quality. Any business can have short-term success, but a top-tier one grows for years. Thankfully, Carnival’s 101% annualized revenue growth over the last five years was incredible. Its growth beat the average consumer discretionary company and shows its offerings resonate with customers.
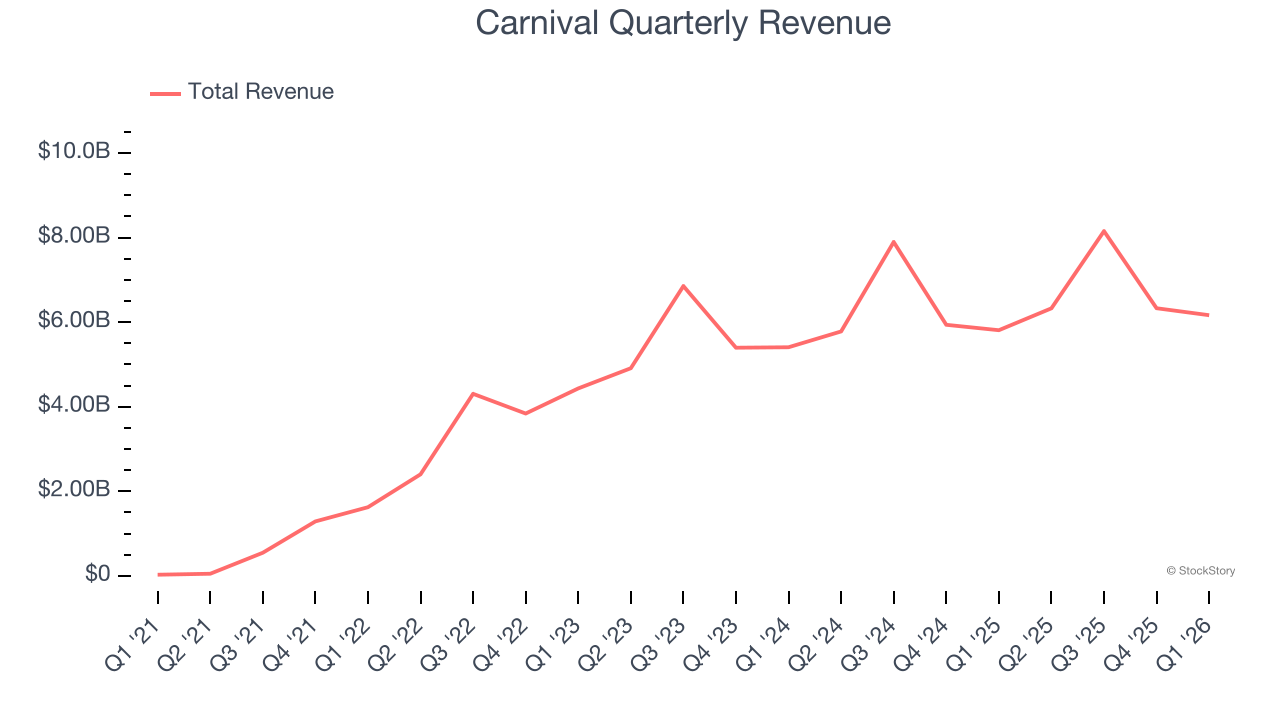
We at StockStory place the most emphasis on long-term growth, but within consumer discretionary, a stretched historical view may miss a company riding a successful new property or trend. Carnival’s recent performance shows its demand has slowed significantly as its annualized revenue growth of 9.3% over the last two years was well below its five-year trend. 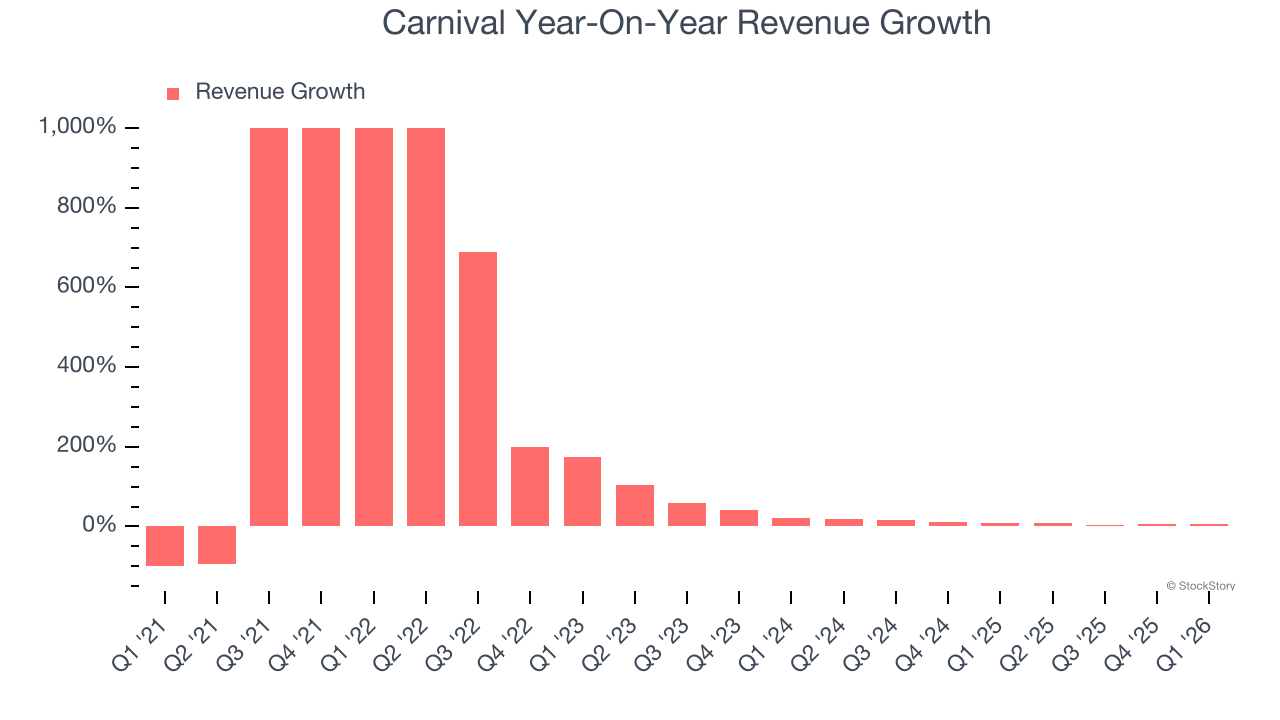
We can better understand the company’s revenue dynamics by analyzing its number of passenger cruise days, which reached 24.4 million in the latest quarter. Over the last two years, Carnival’s passenger cruise days averaged 1.2% year-on-year growth. Because this number is lower than its revenue growth during the same period, we can see the company’s monetization has risen. 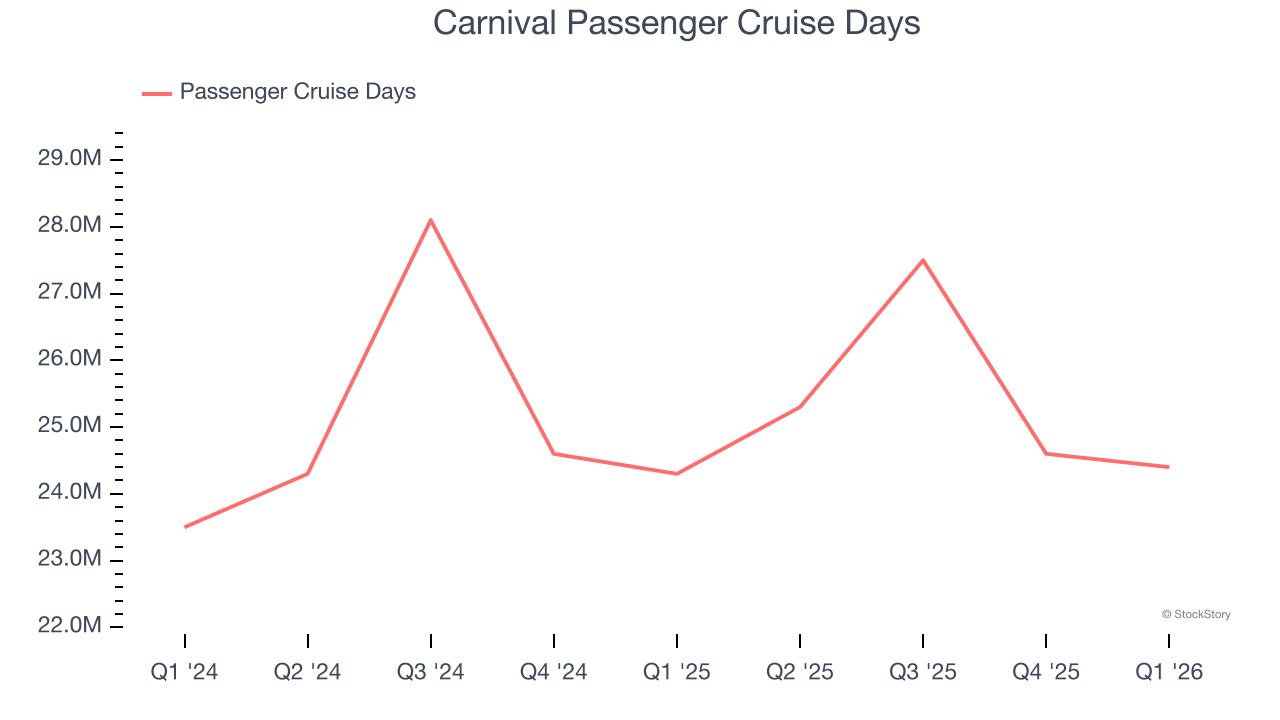
This quarter, Carnival grew its revenue by 6.1% year on year, and its $6.17 billion of revenue was in line with Wall Street’s estimates.
Looking ahead, sell-side analysts expect revenue to grow 3.8% over the next 12 months, a deceleration versus the last two years. This projection is underwhelming and implies its products and services will face some demand challenges.
WHILE YOU’RE HERE: The Next Palantir? One satellite company captures images of every point on Earth. Every single day. The Pentagon wants it. Hedge funds are using it to beat earnings. You’ve probably never heard of it.
This is what the early days of Palantir looked like before it became a $437 billion giant. Same playbook. Different technology. If you missed Palantir, you need to see this. Claim The Stock Ticker for Free HERE.
Operating Margin
Operating margin is an important measure of profitability as it shows the portion of revenue left after accounting for all core expenses – everything from the cost of goods sold to advertising and wages. It’s also useful for comparing profitability across companies with different levels of debt and tax rates because it excludes interest and taxes.
Carnival’s operating margin has risen over the last 12 months and averaged 16% over the last two years. The company’s higher efficiency is a breath of fresh air, but its suboptimal cost structure means it still sports inadequate profitability for a consumer discretionary business.
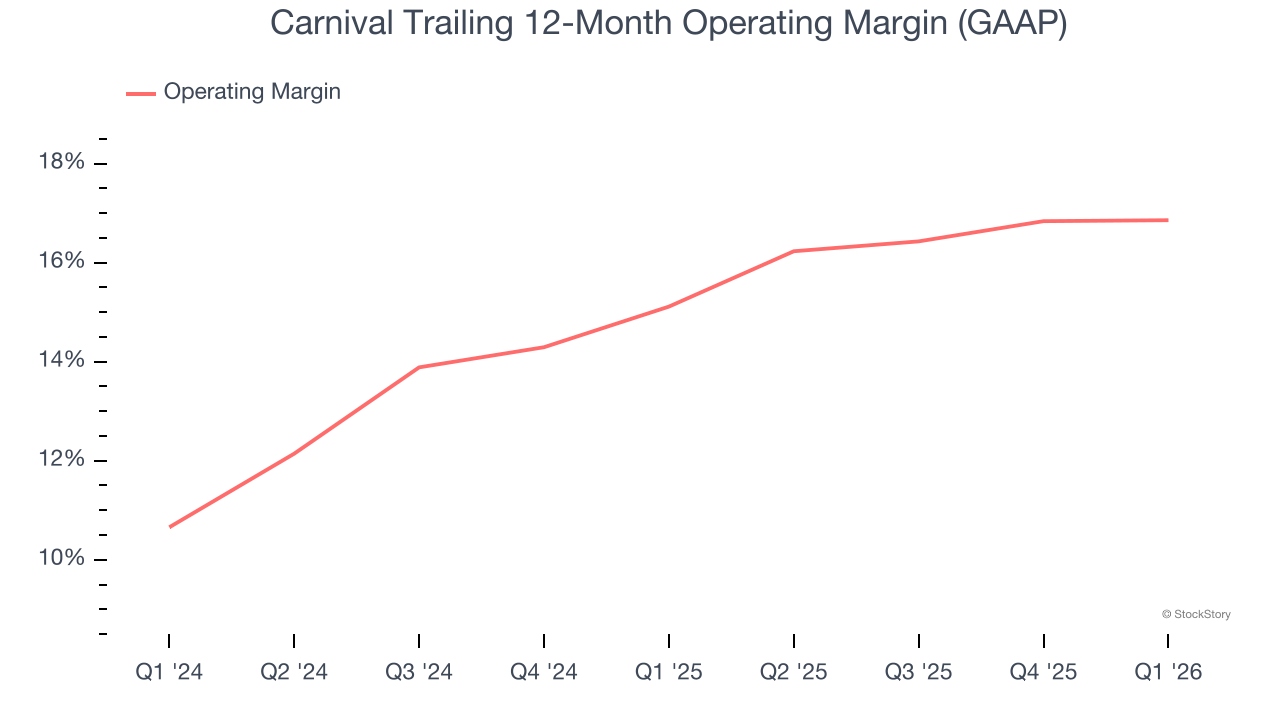
In Q1, Carnival generated an operating margin profit margin of 9.8%, in line with the same quarter last year. This indicates the company’s overall cost structure has been relatively stable.
Earnings Per Share
Revenue trends explain a company’s historical growth, but the long-term change in earnings per share (EPS) points to the profitability of that growth – for example, a company could inflate its sales through excessive spending on advertising and promotions.
Carnival’s full-year EPS flipped from negative to positive over the last five years. This is encouraging and shows it’s at a critical moment in its life.
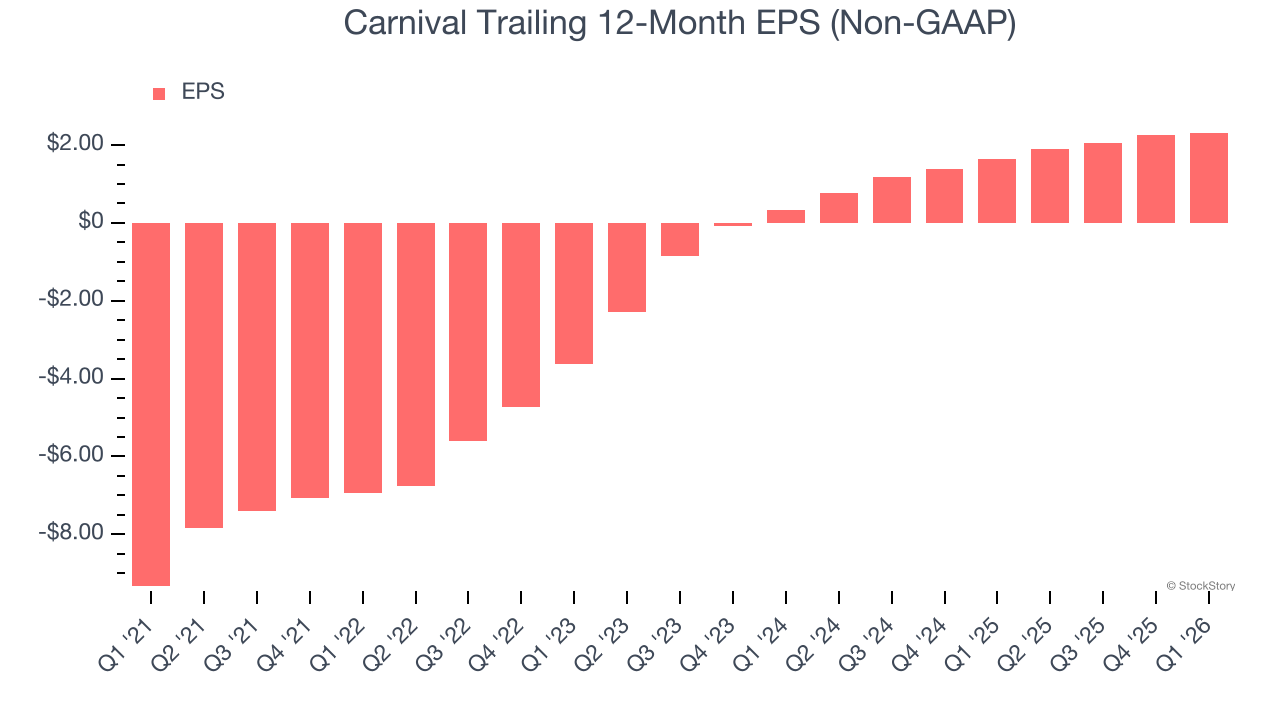
In Q1, Carnival reported adjusted EPS of $0.20, up from $0.13 in the same quarter last year. This print beat analysts’ estimates by 8.9%. Over the next 12 months, Wall Street expects Carnival’s full-year EPS of $2.32 to shrink by 1%.
Key Takeaways from Carnival’s Q1 Results
It was good to see Carnival beat analysts’ EPS expectations this quarter. On the other hand, its EBITDA guidance for next quarter missed and its full-year EBITDA guidance fell short of Wall Street’s estimates. Overall, this was a softer quarter. The stock traded down 2.9% to $24.55 immediately following the results.
Carnival didn’t show it’s best hand this quarter, but does that create an opportunity to buy the stock right now? If you’re making that decision, you should consider the bigger picture of valuation, business qualities, as well as the latest earnings. We cover that in our actionable full research report which you can read here (it’s free).