Security and aerospace company Northrop Grumman (NYSE: NOC) met Wall Street’s revenue expectations in Q3 2026, with sales up 6.7% year on year to $11.12 billion. The company’s outlook for the full year was close to analysts’ estimates with revenue guided to $44 billion at the midpoint. Its GAAP profit of $7.89 per share was 9.6% above analysts’ consensus estimates.
Is now the time to buy Northrop Grumman? Find out by accessing our full research report, it’s free.
Northrop Grumman (NOC) Q3 2026 Highlights:
- Revenue: $11.12 billion vs analyst estimates of $11.15 billion (6.7% year-on-year growth, in line)
- EPS (GAAP): $7.89 vs analyst estimates of $7.20 (9.6% beat)
- The company reconfirmed its revenue guidance for the full year of $44 billion at the midpoint
- Operating Margin: 11.4%, in line with the same quarter last year
- Free Cash Flow Margin: 12.9%, similar to the same quarter last year
- Backlog: $109.6 billion at quarter end, up 19.8% year on year
- Market Capitalization: $72.54 billion
Company Overview
Responsible for the development of the first stealth bomber, Northrop Grumman (NYSE: NOC) specializes in providing aerospace, defense, and security solutions for various industry applications.
Revenue Growth
A company’s long-term performance is an indicator of its overall quality. Any business can put up a good quarter or two, but many enduring ones grow for years. Unfortunately, Northrop Grumman’s 3.2% annualized revenue growth over the last five years was sluggish. This was below our standard for the industrials sector and is a tough starting point for our analysis.
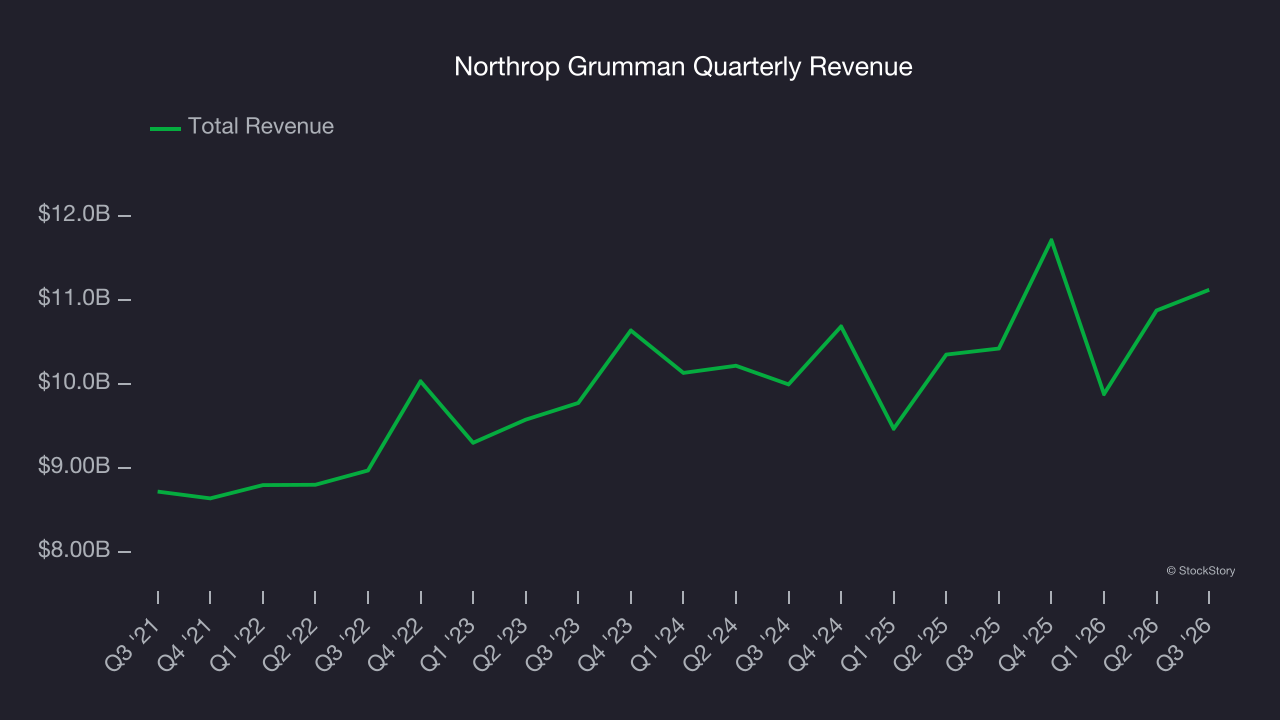
Long-term growth is the most important, but within industrials, a half-decade historical view may miss new industry trends or demand cycles. Northrop Grumman’s annualized revenue growth of 3.1% over the last two years aligns with its five-year trend, suggesting its demand was consistently weak. 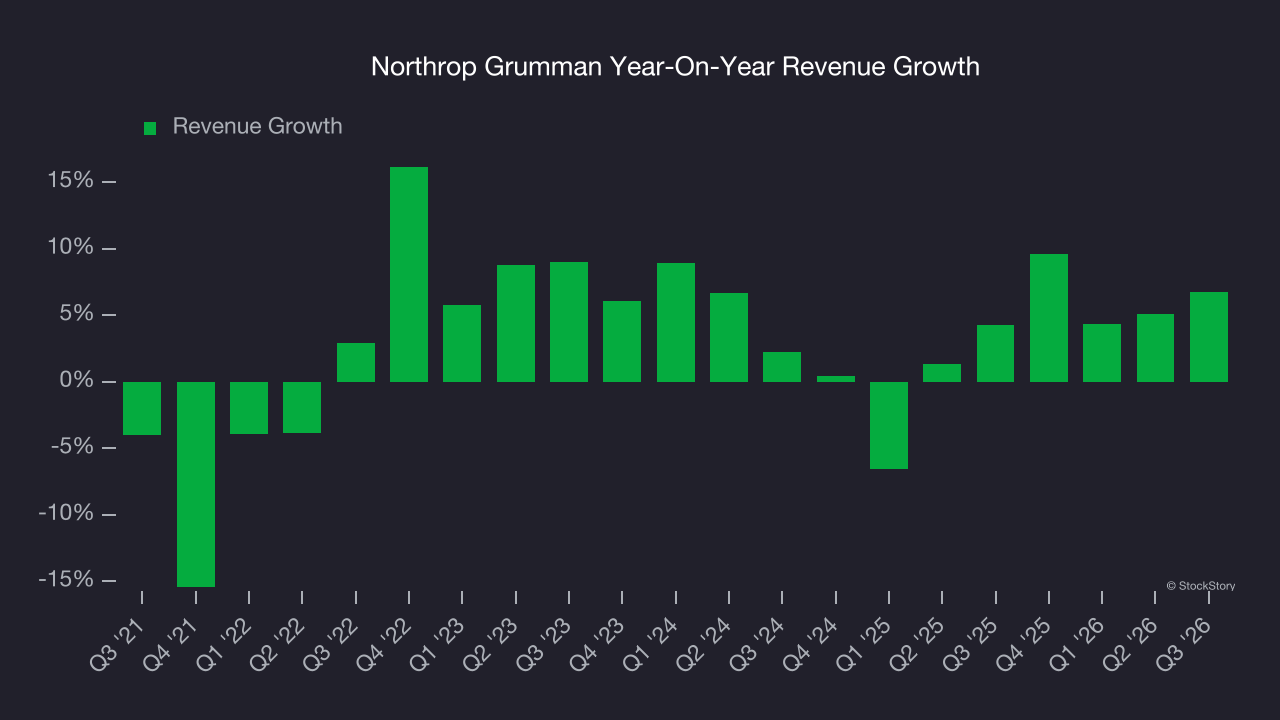
We can better understand the company’s revenue dynamics by analyzing its backlog, or the value of its outstanding orders that have not yet been executed or delivered. Northrop Grumman’s backlog reached $109.6 billion in the latest quarter and averaged 10.4% year-on-year growth over the last two years. Because this number is better than its revenue growth, we can see the company accumulated more orders than it could fulfill and deferred revenue to the future. This could imply elevated demand for Northrop Grumman’s products and services but raises concerns about capacity constraints. 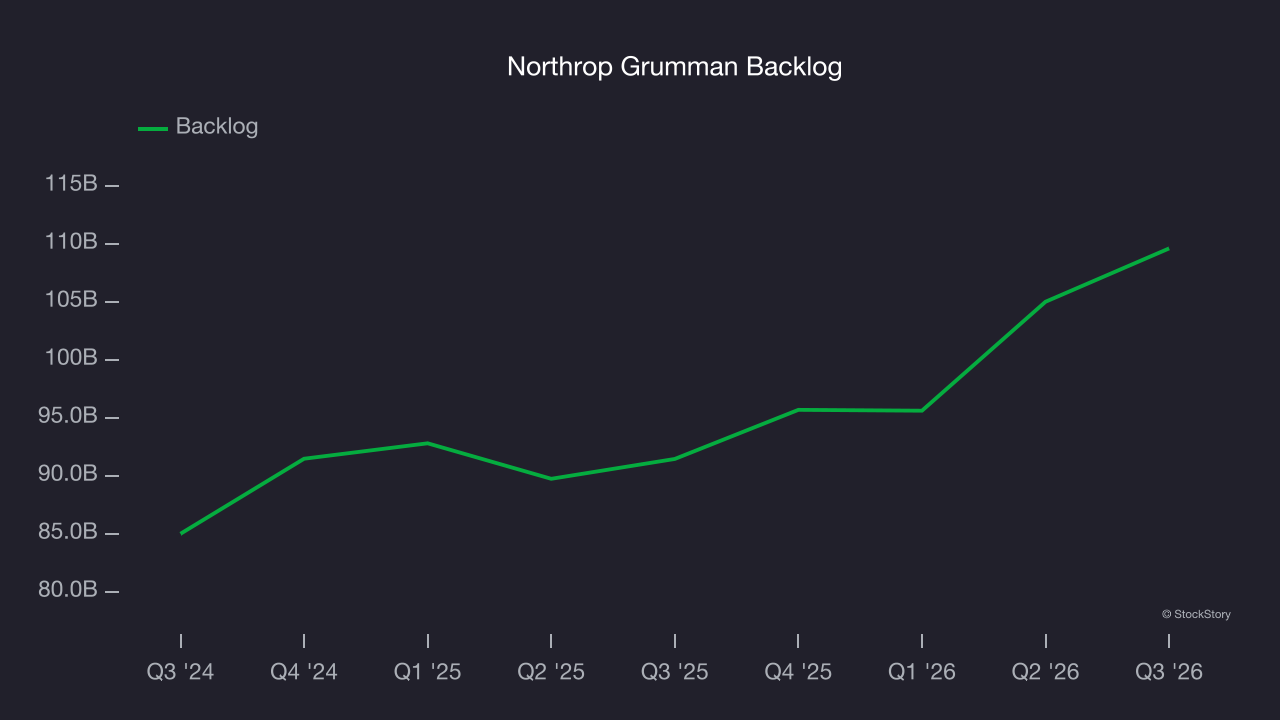
This quarter, Northrop Grumman grew its revenue by 6.7% year on year, and its $11.12 billion of revenue was in line with Wall Street’s estimates.
Looking ahead, sell-side analysts expect revenue to grow 5.9% over the next 12 months. Although this projection indicates its newer products and services will spur better top-line performance, it is still below the sector average.
ONE MORE THING: 3 Hidden Platforms Growing 3X Faster than Amazon, Google, and PayPal. Amazon, Google, and Meta all followed the same playbook: Dominate an ignored market. Build an unbeatable moat. Scale until you’re unstoppable.
These three platforms are running that exact playbook right now. The early investors in Amazon made fortunes. The early investors in these could do the same. Get All 3 Stocks Here for FREE.
Operating Margin
Northrop Grumman’s operating margin has more or less stayed the same over the last 12 months , averaging 9.6% over the last five years. This profitability was higher than the broader industrials sector, showing it did a decent job managing its expenses.
Looking at the trend in its profitability, Northrop Grumman’s operating margin might have fluctuated slightly but has generally stayed the same over the last five years. This raises questions about the company’s expense base because its revenue growth should have given it leverage on its fixed costs, resulting in better economies of scale and profitability.
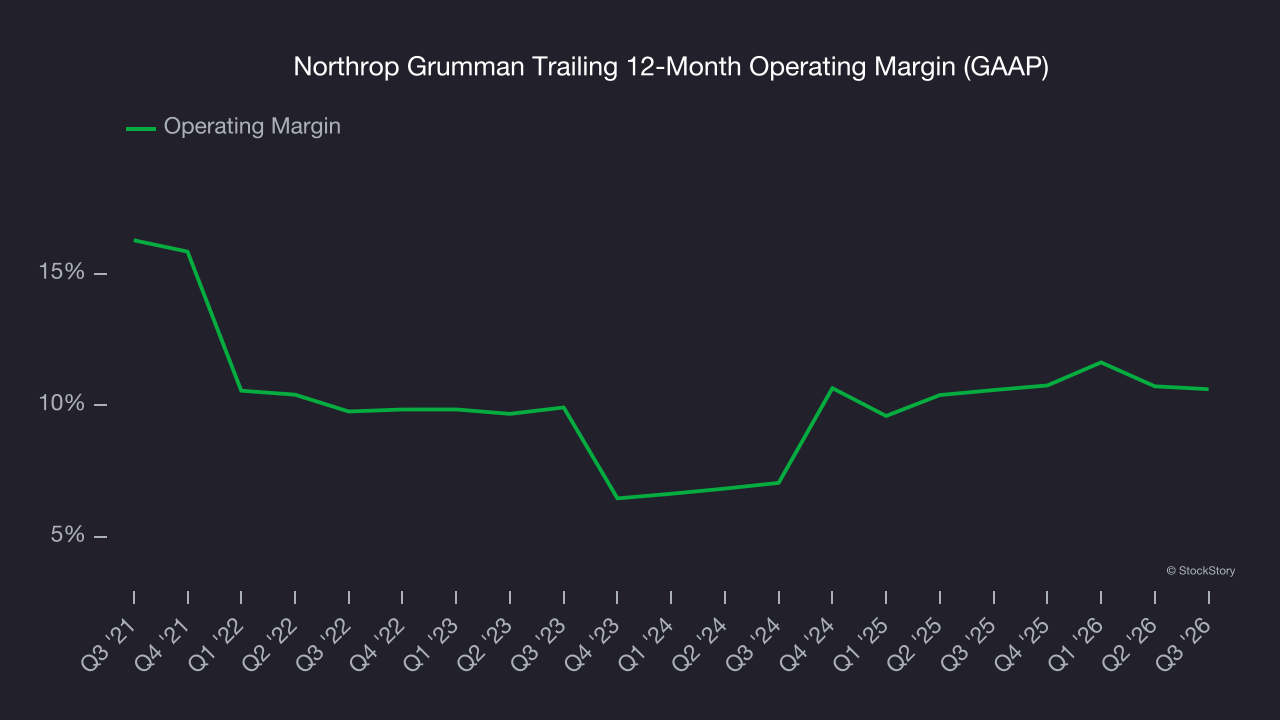
In Q3, Northrop Grumman generated an operating margin profit margin of 11.4%, in line with the same quarter last year. This indicates the company’s overall cost structure has been relatively stable.
Earnings Per Share
We track the long-term change in earnings per share (EPS) for the same reason as long-term revenue growth. Compared to revenue, however, EPS highlights whether a company’s growth is profitable.
Northrop Grumman’s weak 2.2% annual EPS growth over the last five years aligns with its revenue performance. This tells us it maintained its per-share profitability as it expanded.
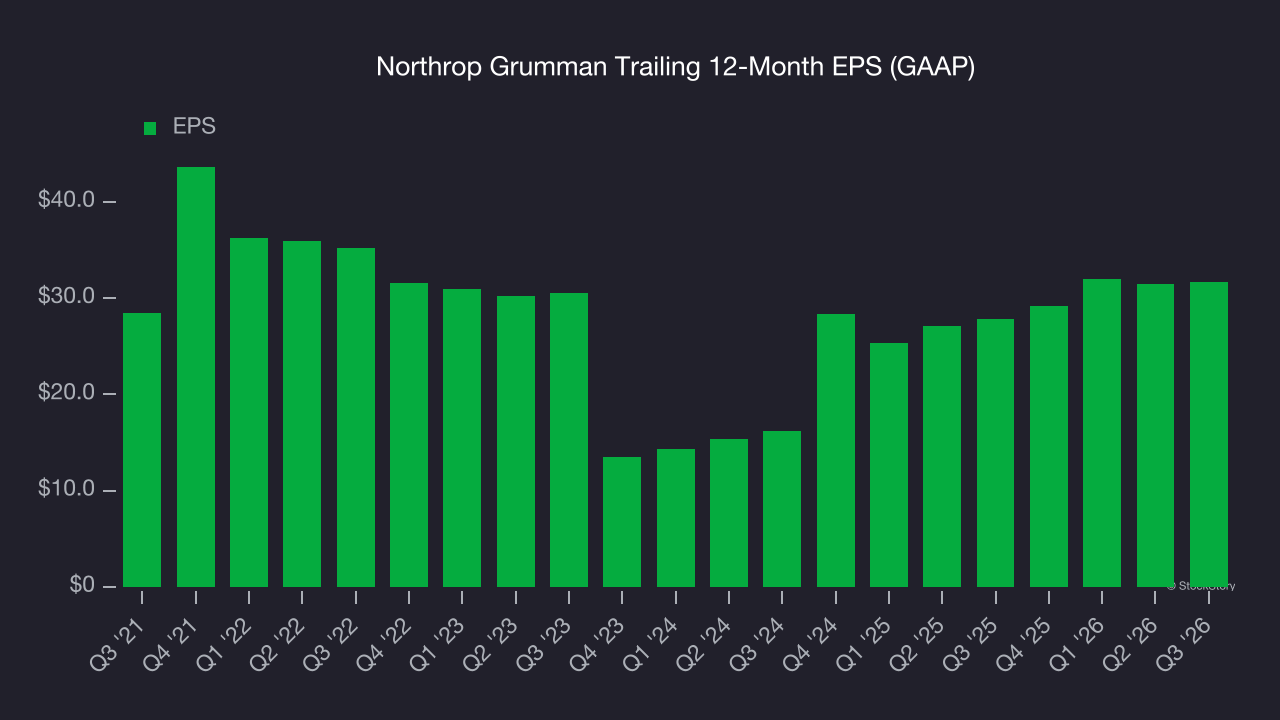
Like with revenue, we analyze EPS over a more recent period because it can provide insight into an emerging theme or development for the business.
Northrop Grumman’s two-year annual EPS growth of 40.1% was fantastic and topped its 3.1% two-year revenue growth.
Diving into the nuances of Northrop Grumman’s earnings can give us a better understanding of its performance. A two-year view shows that Northrop Grumman has repurchased its stock, shrinking its share count by 2.8%. This tells us its EPS outperformed its revenue not because of increased operational efficiency but financial engineering, as buybacks boost per share earnings. 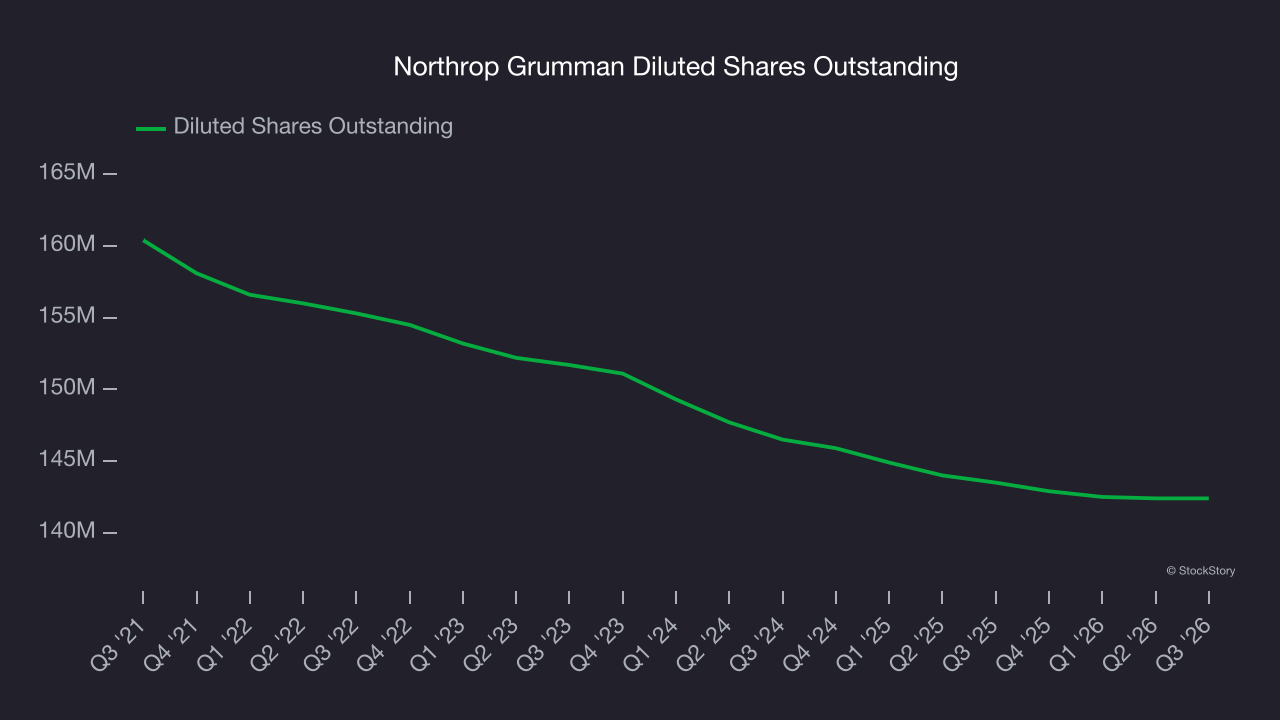
In Q3, Northrop Grumman reported EPS of $7.89, up from $7.67 in the same quarter last year. This print beat analysts’ estimates by 9.6%. Over the next 12 months, Wall Street expects Northrop Grumman’s full-year EPS to shrink by 6.3% from $31.70 to $29.70.
Key Takeaways from Northrop Grumman’s Q3 Results
It was good to see Northrop Grumman beat analysts’ EPS expectations this quarter. On the other hand, its revenue was in line. Zooming out, we think this was a mixed quarter. The stock traded up 2.1% to $521.55 immediately following the results.
Is Northrop Grumman an attractive investment opportunity right now? What happened in the latest quarter matters, but not as much as longer-term business quality and valuation, when deciding whether to invest in this stock. We cover that in our actionable full research report which you can read here (it’s free).