One of the main riddles of modern macroeconomics is the deep dissonance between official statistical data and ordinary consumers' perception of reality. According to reports from the U.S. Bureau of Labor Statistics (BLS), inflation remains under control, and the economy continues to demonstrate growth. However, millions of people intuitively feel the opposite: basic expenses continue to eat up an ever-larger part of the budget, and real purchasing power is stagnating.
To understand the essence of this dissonance, we need to step away from complex quantitative models overloaded with variables and turn to a qualitative, fundamental understanding of value. The best instrument for such an analysis? An ordinary burger from McDonald’s (MCD).
The Big Mac Index — traditionally used for evaluating currency purchasing power parity — can be applied to measure historical inflation within the United States. The result of this comparison forces a radical reevaluation of the nature of modern economic growth — and a reevalutation of which phase of the market cycle consumers currently find themselves.
The Big Mac Vs. Core Inflation
If we want to measure how a currency depreciates, we need a benchmark. The official Consumer Price Index (CPI), and more accurately its base version — core CPI (excluding volatile food and energy prices) — represents a complex basket of hundreds of goods and services, the composition of which constantly changes.
The Big Mac, however, is a constant. For decades, it has been the exact same two beef patties, cheese, pickles, lettuce, onions, special sauce, and sesame seed bun. It incorporates basic expenses on agricultural raw materials, logistics, electricity, real estate (via restaurant rent), and personnel labor.
Let's compare the dynamics of the price of this unchangeable constant with the official core CPI data for the last 25 years (from 2000 to 2025).
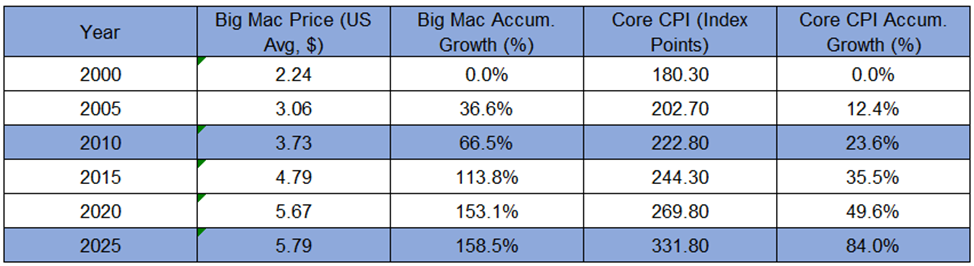
As calculations show, in 2000, the Big Mac cost $2.24 on average. By the end of 2025, its price reached $5.79. This represents cumulative growth of 158.5%. The compound annual growth rate (CAGR) of the Big Mac over that 25-year period is 3.88%.
For this same period, the official core CPI grew from 180.3 to 331.8 points. Cumulative growth comes to only 84%, which gives an annual average rate of 2.47%.
The difference between the real price increase of a base product and official inflation is a colossal 74.5% cumulatively. Why does this gap arise, and where do official statistics hide inflation?
Hedonic Inflation
The answer lies in a term that is rarely discussed outside of academic circles: Hedonic quality adjustment.
Imagine a classic situation: last year, you bought a new flagship smartphone for a hypothetical $1,000. A year passes, and the company releases a new model. It costs the same $1,000, but it now has a 20% more powerful processor, a better camera, and a brighter screen.
For the consumer, nothing has changed. To get a modern phone, they still need to spend exactly $1,000. But official statistics look at this differently. According to the hedonic pricing model, if a good becomes functionally better while preserving its nominal price, it means the cost per unit of consumer utility — or productivity — has decreased.
As a result, the CPI formula records not a stable price of $1,000, but a price drop — let's say to $850. Statistics record deflation in this segment.
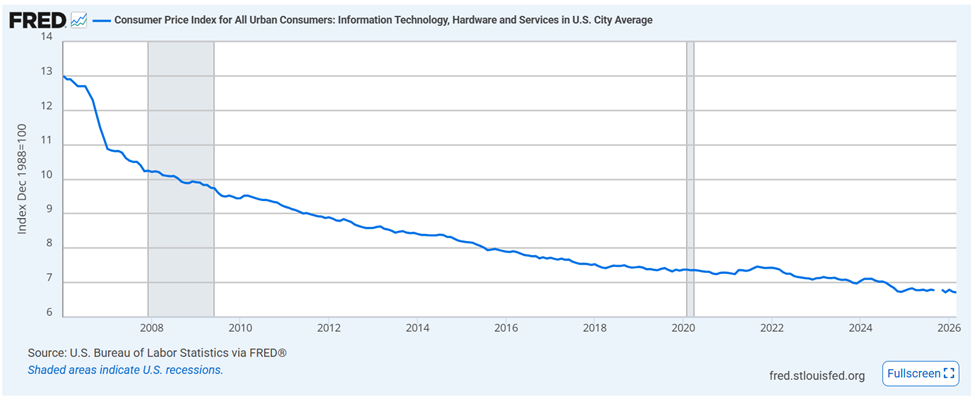
The U.S. Bureau of Labor Statistics offers an official explanation of this methodology. This effect applies to a huge spectrum of goods in the CPI basket: computers, automobiles, household appliances, and software. Technological progress is interpreted as a deflationary factor, which mathematically "extinguishes" the price growth of basic needs. You can see this for yourself by glancing at the official Fed chart, where prices on personal computers and peripherals demonstrate an uninterrupted fall over decades, despite the fact that the receipt at the electronics store isn't getting any smaller.
But it is important to clarify that this is not a conspiracy by governments or central banks to deceive the population. In economics, as in any other science — for example, in physics — there is no limit to perfection, and any methodology has its flaws. The BLS' logic is understandable, attempting to measure a "clean" price change by separating it from technological progress. The problem simply lies in the fact that this imperfect methodology can distort reality. A person cannot pay an electricity bill with the increased productivity of a microchip, nor can they eat the additional megapixels of a camera.
The Big Mac does not become "more powerful" or "smarter." You cannot apply a hedonic adjustment to it. That is exactly why it shows the inflation that people actually feel in their wallets.
Distortion of Real Economic Growth
Understanding the gap between arguably real (Big Mac) and official (core CPI) inflation sheds light on yet another macroeconomic riddle: the obsessive focus on specific GDP growth rates.
Often, we hear analysts sounding the alarm if the U.S. economy only grows by 1% in a year. To a layman, this sounds strange — after all, 1% is still growth. If the country's population increases by 0.5% a year, and GDP grows by 1%, purely mathematically, we should become a little richer — or at the very least not poorer — than last year. Why then do markets panic, and why is the Fed ready to crank up the printing press?
The reason lies in a basic understanding of business and real value. Nominal GDP growth is corrected — deflated — by the official inflation rate to arrive at "real" GDP. But if official inflation is understated by that very 1% to 1.5% because of hedonic adjustments, then a declared economic growth of 1% is actually stagnation, or even a decline in real terms.
For the economy to truly grow in terms of physical production volumes and real wealth, nominal GDP must outpace not only official inflation but also hidden, true inflation. That is exactly why 2% to 3% growth, according to official data, is only the minimum required level for the real, hedonically adjusted economy to truly grow.
Hidden Recession: The U.S. Economy in Big Macs
If official metrics are distorted, what happens if we measure the size of the economy in the most straightforward, fundamental way? Let's recalculate the entire U.S. GDP not in manipulated dollars, but in physical entities. In Big Macs.
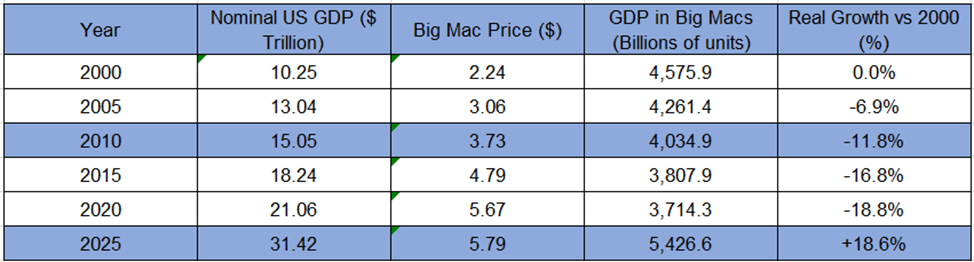
When we conduct this calculation, we see a staggering picture. If we take the nominal GDP of the U.S. and divide it by the average price of a Big Mac in each specific year, the curve of parabolic, endless economic growth suddenly flattens out.
In certain periods of recent years, we will see that the economy, expressed in the equivalent of real base goods, doesn't just stagnate but falls. We produce a colossal amount of nominal dollar value, but the real purchasing power standing behind those dollars shrinks.
The Stock Market in Big Macs: Threatening Overvaluation
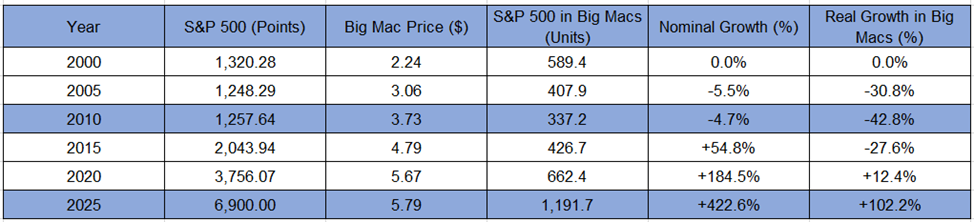
If the real economy in Big Macs has been stuck in a protracted stagnation, then what happened with capital? Let's apply this same "burger deflator" to the main barometer of U.S. wealth — the S&P 500 Index ($SPX). We will simply divide the index values by the cost of a Big Mac in the corresponding years.
This table reveals a staggering picture and explains the nature of the current market cycle.
If you had bought the S&P 500 at the peak of the dot-com bubble in 2000, one point of the index would have cost you approximately 589 Big Macs. 20 years later, by 2020 — before the pandemic stimulus injections began — the index grew to 662 Big Macs. That means that over two decades, the real, physical increase in the market's purchasing power was a negligible 12%. In essence, until 2020, the stock market in Big Macs barely grew at all.
It was simply trying to compensate for hidden inflation and recovering to break-even levels from the post-2000 era.
But then the system broke. The mad work of the "printing press" during the pandemic, coinciding with the technological hype around artificial intelligence (AI), detached stocks from gravity. With the S&P 500 at the 6,900-point level at the end of 2025, the index now costs almost 1,200 Big Macs. The real value of the market almost doubled in just five years.
Today, the S&P 500 looks threateningly expensive even relative to the rapidly appreciating Big Mac. And here arises the main, frightening paradox of modernity: the real economy, measured in basic goods, is languishing somewhere below, barely trying to climb out of a 20-year hole while stock markets simultaneously hit the ceiling — pricing the future as if we are living in an era of unprecedented prosperity.
The Financial Theory of Relativity
Albert Einstein asserted that everything in the world is relative. Unfortunately, modern investors often forget this fundamental law of physics, attempting to measure the value of assets with an absolute ruler — the dollar, which is inherently "elastic" and subject to statistical distortions through hedonic adjustments.
If you look only at nominal charts, it is possible to draw false conclusions. But you only have to change the denominator from an abstract CPI to a physical burger, and the picture of market coordinates radically changes. What seemed like "endless economic growth" actually looks like a hidden 20-year recession of the real sector. What was perceived as a powerful bull market for stocks in the 2010s turns out to be merely a difficult return to purchasing power break-even. And the current situation demonstrates a colossal gap, where overheated financial capital has completely detached itself from a stagnating fundamental base.
It is extremely useful to apply this "theory of relativity" when evaluating markets. The economy can be viewed from different angles, and the results of these observations can differ significantly. This feature should be taken into account when making investment decisions and valuing assets, rather than thinking linearly and limiting oneself to the dollar as the sole metric. Comparing markets in relative, fundamental terms helps to filter out statistical noise, evaluate the current phase of the economic cycle more soberly, and understand the real — rather than paper — dynamics of capital.
On the date of publication, Mikhail Fedorov did not have (either directly or indirectly) positions in any of the securities mentioned in this article. All information and data in this article is solely for informational purposes. For more information please view the Barchart Disclosure Policy here.