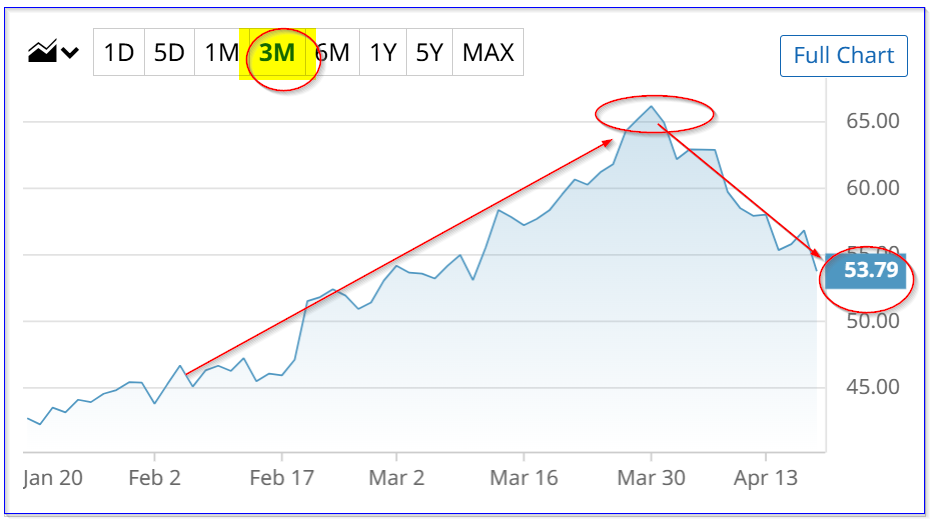
Occidental Petroleum (OXY) stock is well off its recent peak prices. However, tensions in the Middle East are not over, and oil could spike again. It could be time to buy OXY or short out-of-the-money OXY puts.
OXY closed at $53.79 on Friday, April 17, well off its recent peak of $66.24 on March 30. Its Friday close is well below where it stood before the war in Iran started. But if the war starts up, oil will spike again, and OXY stock could move higher.
Covered Call OXY Plays Worked
I discussed selling OXY stock on March 29 as well as shorting out-of-the-money (OTM) call options for existing investors ("Occidental Petroleum Stock May Be at a Peak - Time to Sell OXY Covered Calls?")
For example, the $70 call option contract expiring May 1 had a midpoint premium of $1.80 (i.e., 34 days to expiry). That strike price was over 7% higher than the $65.32 price at the time. The play provided a 2.755% yield (i.e., $1.80/$65.32 = 0.02755).
Today, that call option has dropped to just 7 cents, making that a great play. The covered call investor does not have to wait until expiry to enter an order to “Buy to Close” to cover this short play.
Now it might make sense for traders and/or existing shareholders to buy OXY stock now or to sell out-of-the-money (OTM) puts.
OXY Is Below Price Targets
Analysts have been hiking their forecasts and price targets for Occidental Petroleum. For example, Yahoo! Finance shows that analysts' earnings per share (EPS) estimates for 2026 have risen from $2.16 per share 30 days ago to $4.20 now.
Moreover, Seeking Alpha reports that the average EPS estimate from 23 stock analysts is now $4.39 for 2026. That means OXY stock has a low price/earnings (P/E) ratio:
$53.79/$4.39 EPS est. = 12.25x
Historical Forward P/E Average (past 5 years): 13.09x (Morningstar)
In other words, based on this average forward P/E, OXY stock could be worth $57.47 (i.e., $13.09 x $4.39).
Yahoo! Finance reports that the average price target (PT) from 26 analysts is now $62.32 per share. That's up from $60.28 three weeks ago, as seen in my prior Barchart article. Similarly, Barchart's mean survey price target is now $62.50, up from $59.11.
The bottom line is that OXY stock could be undervalued here.
However, there is no guarantee that OXY will rise to these price targets. So, one way to set a lower buy-in point and also get paid while waiting, is to short out-of-the-money (OTM) put options in near-term periods.
Shorting OTM OXY Puts
For example, the May 22 expiry period (34 days from now) shows that the $50.00 strike price put contract has a midpoint premium of 97 cents. That works out to almost a 2% yield:
$0.97 / $50.00 = 0.0194 = 1.94% short-put yield
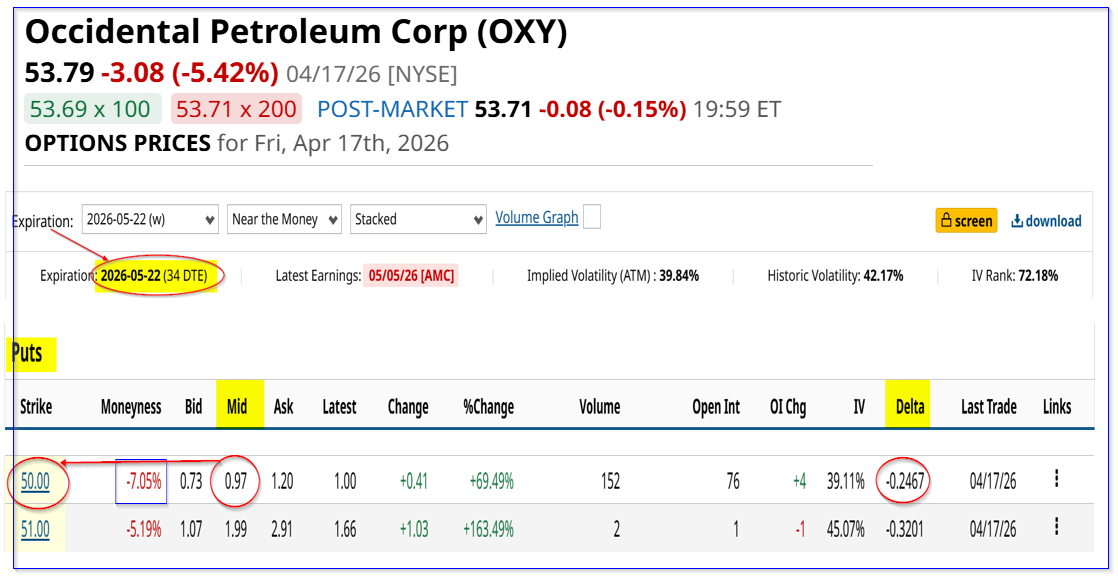
This means that an investor who secures $5,000 in cash or buying power with their brokerage firm can enter an order to “Sell to Open” 1 put contract at $50.00. The account will then immediately receive $97.00:
$97 / $5,000 = 1.94%
This is an attractive return, especially if it can be repeated every month for the next 3 months:
$97 x 3 = $291 / $5,000 invested every time = 5.82%
Note that the delta ratio is low at just -0.24, implying less than a 25% chance that OXY will drop to $50.00 by May 22. However, even if that happens, the breakeven price is lower:
$50.00 - 0.97 = $49.03 breakeven
That's 8.84% below Friday's close. That sets an attractive buy-in point for value investors, especially given the higher price targets as shown above.
The bottom line is that OXY stock looks cheap here, and shorting OTM puts is an attractive way to play it.
On the date of publication, Mark R. Hake, CFA did not have (either directly or indirectly) positions in any of the securities mentioned in this article. All information and data in this article is solely for informational purposes. For more information please view the Barchart Disclosure Policy here.
More news from Barchart