Corn prices have staged a respectable post-harvest rally of 59 cents since bottoming out in the low $4.30s earlier this winter, and July 2026 futures are now hovering near $4.87. That's not earth-shattering. Still, it's a solid lift from the doldrums corn traded in from September to December. The fundamental picture suggests there's room for more upside as we head toward planting season—especially with geopolitics throwing some curveballs that could tighten the supply side faster than the market expects.
The big picture on supplies still looks ample after last year's monster U.S. crop. USDA is calling for 2026/27 production around 15.8 billion bushels, down roughly 7% from 2025 on fewer planted acres—probably in the 94-million-acre range. Ending stocks will stay comfortable, maybe 1.8–2.1 billion bushels. On paper, that screams "well-supplied market." But here's where things get interesting: those numbers were built before the Strait of Hormuz mess really heated up.
Tariffs, U.S.-Israel-Iran tensions, and ongoing disruptions in the Strait have sent fertilizer prices soaring. Urea is up 30–60% in some markets, anhydrous ammonia has jumped over $900 a ton, and diesel isn't exactly cheap either. Corn is a nitrogen hog. When input costs spike like this right before spring fieldwork, farmers start doing the math. Some will plant fewer corn acres and swing toward soybeans or other crops that need less fertilizer. Others may cut back on rates if the product tightens or becomes expensive, which could shave yields even if the acres are planted. Either way, the effective supply picture for new-crop corn is starting to look tighter than the USDA's early forecast suggests.
Demand, meanwhile, isn't rolling over. Ethanol plants are humming—steady gasoline use, the upcoming summer driving season, and export demand keep that 5.45-5.6-billion-bushel slice locked in. Feed use is solid, and U.S. corn exports have been running at a record pace as global buyers hunt for a reliable supply. Higher energy prices from the Middle East tensions actually give ethanol a little extra tailwind.
Look, nobody's calling for a blow-off top here. But the combination of reduced production potential, cost-driven acreage discipline, and resilient demand gives the bulls a real edge heading into the critical planting and growing window. If weather throws even a modest scare into the mix, those $4.90–$5.00 July futures levels start looking pretty reasonable. The short-term fundamentals aren't bearish anymore—they're quietly turning constructive.
Technicals
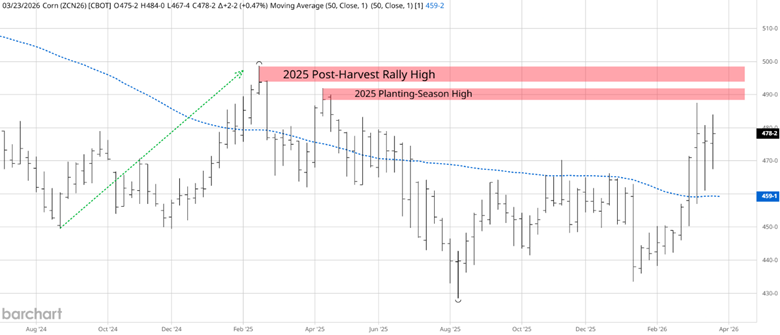
Source: Barchart
The weekly chart confirms the short-term bullish corn prices. Last year, producers were able to lock in slightly higher prices in the deferred December contract. This year, we see the July contract approaching significant areas of resistance. The weekly 50-SMA (simple moving average) is flat. But the price action on the weekly chart shows a higher high and a higher low, indicating a higher-trending price.
Will the global events be enough to give producers another opportunity to lock in higher prices (hedge) for the new crop?
Correlated Market Year
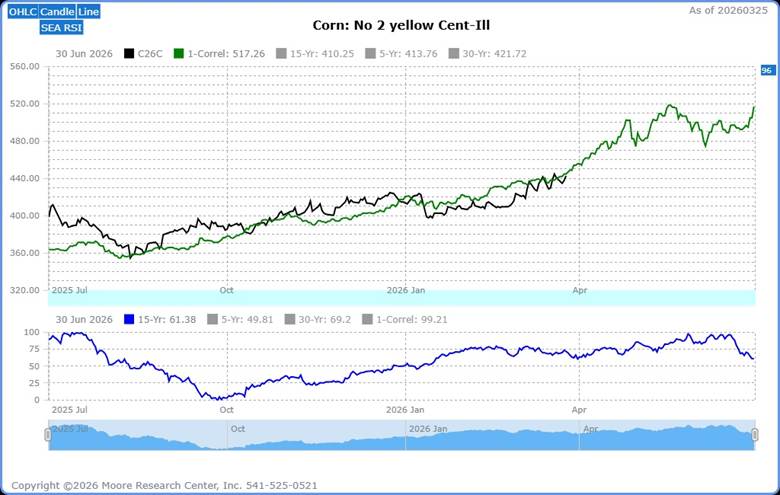
Source: Moore Research Center, Inc. (MRCI)
Correlated market years tend to be stronger when 5 or more years correlate. The cash corn market currently has a 1-year correlation(green line) of 86% with 1996. Though this is a single correlated year, the corn market appears poised for a significant upward move over the next 30 days.
The 15-year seasonal pattern (blue line) shows that during the 1st quarter, prices typically trade higher than the previous 4th-quarter high. The current price of cash corn (black line) shows that corn has continued that pattern for this season. Another interesting observation is that the 2nd quarter usually trades higher than the 1st quarter, which will coincide with the upcoming seasonal pattern we will discuss.
Seasonal Pattern
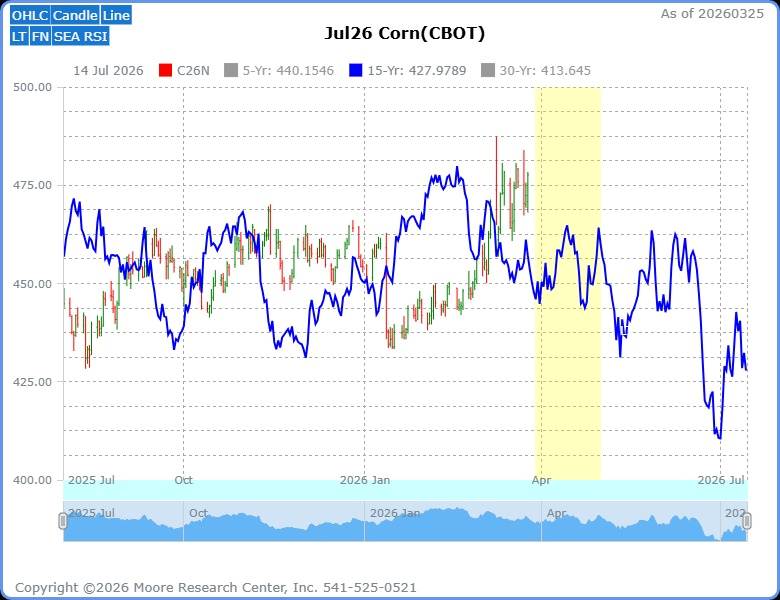
Source: MRCI
The July corn futures contract has a 12 of 15-year 80% probability of closing higher on approximately May 01 than on March 29. During hypothetical testing over these 15 years, the seasonal window has returned 20 ¼ cents, or $1,013.33 per standard-sized contract. The yellow box represents the optimal seasonal window. The optimal window will last about 34 calendar days, giving short- and intermediate-term traders an opportunity to participate.
As a crucial reminder, while seasonal patterns can provide valuable insights, they should not be the basis for trading decisions. Traders must consider various technical and fundamental indicators, risk management strategies, and market conditions to make informed, balanced trading decisions.
Assets to Trade the Corn Market
Traders in the U.S. corn market have several options to participate:
- The primary avenue is futures contracts on the Chicago Board of Trade (CBOT), where corn futures are actively traded, allowing speculation on price movements or hedging against risks: the standard size contract (ZC), the Mini-contract (XN), and the Micro-contract (CE).
- Options on these futures provide additional flexibility, enabling traders to buy or sell at specific prices.
- Additionally, exchange-traded funds (ETFs) like the Teucrium Corn Fund (CORN) offer retail investors a way to gain exposure without trading futures directly.
In Closing…
Corn has put together a respectable 59-cent rally since those dreary low-$4.30s, with July 2026 futures now near $4.87. On the surface, big supplies from last year's record crop and the USDA's early look at a 15.8-billion-bushel 2026 crop (on about 94 million acres) still paint a fairly comfortable stocks picture. But dig a little deeper, and the story shifts: those projections were made before the Strait of Hormuz disruptions really kicked in. Soaring fertilizer costs—urea up 30-60%, anhydrous ammonia pushing past $900 a ton in places—hit corn especially hard as a heavy nitrogen user. Farmers are already rethinking acres, potentially shifting more toward soybeans or dialing back application rates, which could quietly tighten effective new-crop supply faster than the balance sheets suggest.
Demand isn't fading either. Ethanol plants keep running strong with the summer driving season ahead, feed use holds steady, and U.S. exports have been moving at a solid clip as buyers seek reliable supplies. Throw in the technicals showing higher highs and lower lows on the weekly chart, a strong historical correlation with bullish years, and the reliable seasonal tendency for July corn to gain into early May, and the short-term setup feels quietly constructive for the bulls. Nobody's expecting a runaway rally, but the combination of cost-driven acreage discipline, resilient demand, and potential weather surprises gives producers a fresh window to consider hedging or pricing at better levels than we've seen in months. It's a reminder that in the corn market, geopolitics and input costs can reshape fundamentals more quickly than many realize—something worth keeping an eye on as planting gets underway.
On the date of publication, Don Dawson did not have (either directly or indirectly) positions in any of the securities mentioned in this article. All information and data in this article is solely for informational purposes. For more information please view the Barchart Disclosure Policy here.
More news from Barchart