

To be quite blunt, unusual options activity represents an arena filled with narratives and backstories rather than hard facts. While analyzing the interplay between volume and open interest can theoretically indicate the underlying sentiment of smart money traders, the bottom line is that no one is absolutely sure what these market participants are thinking.
Let’s just be brutally honest here. If scanning options activity and the various ratios, skews and exposures were that easy and intuitively predictive, everybody would be doing it. They’re not and the reason is that the derivatives market is just one of many tools to assess. It’s not a magic indicator.
That being said, speculative traders really need to keep their eyes on Royal Caribbean (RCL). Right now, expectations for RCL stock are poor, with the security incurring an 8% Weak Sell rating from the Barchart Technical Opinion indicator. In the trailing week, RCL has slipped nearly 6%, while in the past month, it’s down roughly 12%.
Nevertheless, investors historically have a tendency of buying the dip in RCL stock. Assuming that the same or similar sentiment regime holds, RCL enjoys a strong chance of upside. Therefore, a gap exists between the security’s expected outcome and its likely outcome — a differential that could potentially be exploited.
In fairness, outside circumstances don’t look particularly appealing for Royal Caribbean. In the options market, total volume for RCL stock sat at 5,855 contracts, representing a 25.55% drop from the one-month average. What really made the picture iffy, though, was the options flow data.
Options flow exclusively focuses on big block transactions likely placed by institutional investors. On Monday, net trade sentiment landed at $541,200, decidedly favoring the bears by a wide margin. Amid broader economic concerns, the skepticism is understandable.
Still, the quantitative picture tells a much different tale.
RCL Stock Features a Price Density Delta That No One is Talking About
Since we’re being candid with each other, I’m going to let you know what I consider to be an uncomfortable truth, a realization that sadly came very late for me: technical analysis the way that it is most commonly practiced is completely heuristic. Part of the reason why I believe the financial publication industry is suffering right now is that the general public is waking up to this realization too.
Serious question: what’s the difference between genuine technical analysis and some internet rando drawing a line across the chart? No one knows. But I’ll say this much: don’t ever let anyone tell you that America isn’t the greatest country in the world. There’s no other place where irrationality can be so gratuitously monetized.
Getting back to RCL stock, the quantitative approach’s most valuable contribution is to provide a decision-making reference point. In every decision that you make involving the expenditure of limited resources, you need to determine whether the potential benefits outweigh the collective costs and risks. If you don’t know the probabilistic spectrum of both elements, how can you possibly make a sound decision?
This is what truly irritates me about technical and also fundamental analysis. These experts spit out a presumed outcome, sure, but they don’t establish a counterfactual baseline to determine whether the proposed action is actually efficient or superior to random or normal conditions.
In effect, they’re proposing decisions for the sake of proposing decisions.
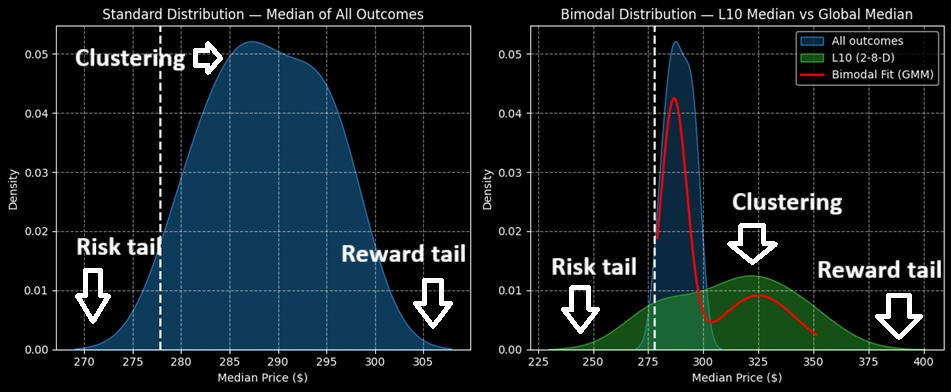
The quantitative approach is different. For RCL stock, the expected 10-week returns form a distributional curve, with median outcomes generally ranging from $270 to $307 (assuming an anchor price of $277.80, Monday’s close). Further, price clustering is expected to be predominant at around $287.
However, we know through GARCH (Generalized Autoregressive Conditional Heteroskedasticity) studies that the diffusional property of volatility is a clustered, non-linear phenomenon. By logical deduction, then, we can infer that different market stimuli yield different market outcomes. This is basically Newtonian mechanics but adapted for the financial markets.
Quantitatively, the current structure of RCL stock is arranged in a 2-8-D formation: two up weeks, eight down weeks, with an overall downward slope. Under this condition, the forward 10-week returns would form a stretched distributional curve, with the risk tail extending to $225 while the reward tail jumps to $400.
What’s most fascinating? Price clustering would be expected to occur around $324. As such, you’re looking at a 12.89% positive delta in price density dynamics that no one is talking about. That’s your information arbitrage opportunity right there.
Picking Out a Compelling Trade
It’s not all mathematical theory when it comes to quantitative analysis. Indeed, one of the beautiful aspects of the methodology is that we can make decisions based on empirical data.
For those looking for an aggressive trade that’s within the realm of rationality, you may consider the 310/320 bull call spread expiring Dec. 19. This transaction requires RCL stock to rise through the second-leg strike ($320) at expiration to earn the 365.12% maximum payout.
Under standard expectations (using the Black-Scholes-Merton model, no doubt), the probability of profit for this trade — that is, the chance to hit the breakeven price of $312.15 at expiration — is set at a lowly 20.4%. However, the quant approach offers a completely different narrative, which is where the arbitrage opportunity lies.
Essentially, the terminal median of RCL stock is forecasted to land at $320 on Dec. 19, which means that this price represents the 50% probability level. If we’re talking about the odds of RCL reaching $312.15, you might be looking at around a 55% probability rate.
Either way, the data shows that it’s not projected to be anywhere near 20.4%, which is where the disagreement comes in. Please keep in mind that I’m not saying that I’m right and the market is wrong; I could easily look like the foolish one here. However, at bare minimum, RCL stock appears to be a golden arbitrage opportunity that you should at least put on your radar.
On the date of publication, Josh Enomoto did not have (either directly or indirectly) positions in any of the securities mentioned in this article. All information and data in this article is solely for informational purposes. For more information please view the Barchart Disclosure Policy here.
More news from Barchart
- You Can Now Bet on 4x Upside in S&P 500 Stocks with This ETF. Should You?
- Royal Caribbean’s (RCL) Options Implosion Offers Up a Massive Informational Arbitrage Trade
- Microsoft Produces Strong FCF As Expected - Shorting OTM Puts is an Attractive Play
- Use This Options Strategy as a ‘Side Hustle’ to Generate Steady Income in Retirement


