

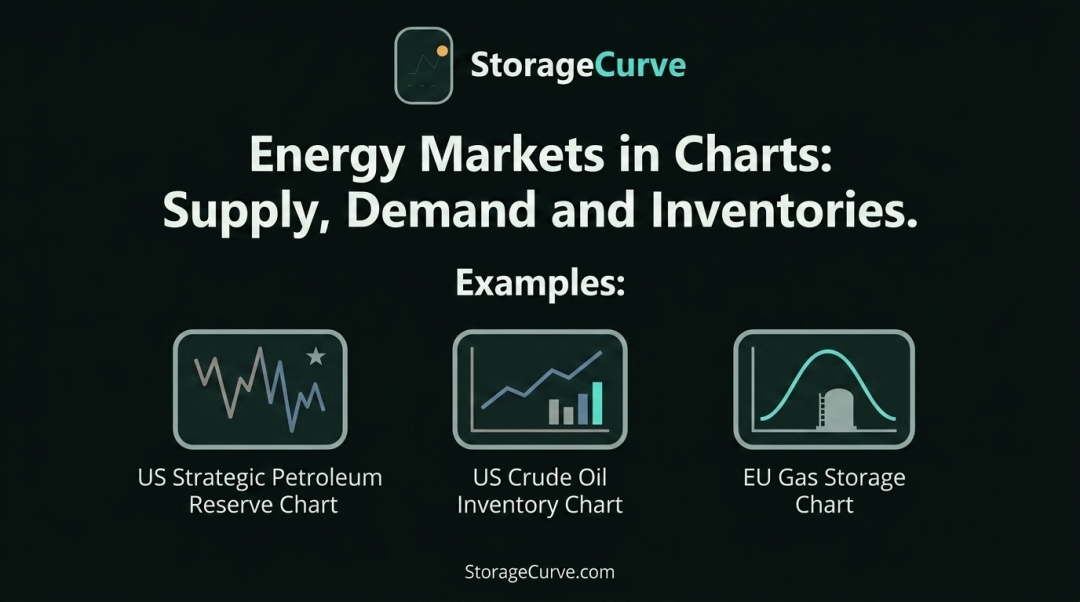
Kalmar, Sweden - September 03, 2026. StorageCurve has launched a free energy-market data platform designed to make official oil, natural gas and electricity statistics easier to track and interpret. The site brings together data from sources including the U.S. Energy Information Administration (EIA), Gas Infrastructure Europe (GIE), ENTSO-E and European national energy authorities, presenting supply, demand and inventory data through interactive charts.
The platform is aimed at investors, energy-market participants, analysts and other users who want to follow changes in physical energy markets without assembling multiple datasets internally or relying on paid data products.
StorageCurve was developed by founder Per after identifying a recurring problem in energy-market analysis: much of the underlying information is publicly available, but converting it into consistent historical and seasonal comparisons often requires significant work.
“I built StorageCurve because a large amount of valuable energy data already exists, but following it across different sources and putting it into market context can be unnecessarily difficult,” said Per, founder of StorageCurve. “The objective is straightforward: take the underlying data, show it clearly, and let people see how supply, demand and inventories are changing.”
Energy security puts inventories back in focus
The launch comes during a period of renewed volatility in global energy markets. The ongoing Iran conflict and uncertainty surrounding Middle Eastern oil flows have increased attention on crude availability and strategic reserves. On September 3, Brent crude was trading around $95 per barrel as markets continued to assess the risk of disruption to Middle Eastern supply.
Against this backdrop, StorageCurve tracks both U.S. commercial crude inventories and the U.S. Strategic Petroleum Reserve (SPR) separately.
The distinction is important. Commercial inventories reflect the operating balance of the petroleum market, while the SPR is a government-controlled emergency stockpile whose movements are driven by policy decisions rather than normal seasonal market activity. StorageCurve therefore avoids treating the SPR as ordinary commercial storage.
The platform also monitors Cushing, Oklahoma inventories, the physical delivery location for NYMEX WTI futures, allowing users to distinguish changes at the key pricing hub from movements in overall U.S. crude stocks.
European gas storage remains below seasonal norms
European natural gas is another area receiving increased attention ahead of the 2026–2027 winter.
StorageCurve's latest available data show EU underground gas inventories approximately 21.9% below their five-year seasonal average. The platform compares current storage with previous years and historical seasonal ranges rather than presenting the absolute storage percentage in isolation.
The European Commission has said that storage filling targets remain achievable and that there is currently no immediate security-of-supply concern for winter 2026–2027. At the same time, the Commission continues to monitor oil and gas markets because of geopolitical uncertainty and changing European supply patterns.
Following the physical balance
StorageCurve is built around a fundamental principle of commodity markets: over time, the relationship between supply and demand shapes price.
As Adam Smith wrote in The Wealth of Nations:
“The market price of every particular commodity is regulated by the proportion between the quantity brought to market and the demand.”
For energy markets, inventories provide one of the clearest ways to observe that balance. When supply exceeds demand, stocks tend to build. When demand exceeds available supply, inventories tend to draw.
StorageCurve tracks these changes across crude oil, natural gas and electricity markets, placing current inventory levels alongside historical data and seasonal patterns.
“Over longer time horizons, supply, demand and the balance between them are what govern price,” said Per, founder of StorageCurve. “Inventories make part of that balance visible. The purpose of StorageCurve is to make that information easier to follow, compare and understand.”
Rather than looking at a single inventory number in isolation, StorageCurve shows how current conditions compare with previous years, seasonal averages and historical ranges. This provides market participants with additional context for understanding whether physical energy balances are tightening or loosening.
About StorageCurve
StorageCurve is an independent energy-market data platform launched in 2026. It transforms official oil, natural gas and electricity data into interactive charts focused on supply, demand, inventories and physical market balances. Sources include the U.S. Energy Information Administration, Gas Infrastructure Europe, ENTSO-E, NVE, Energiföretagen, SFOE/BFE and Fraunhofer ISE Energy-Charts.
Website: https://storagecurve.com/
Media contact: Per, Founder — via StorageCurve contact
Media Contact
Company Name: Seodev AB
Contact Person: Per
Email: Send Email
City: Kalmar
Country: Sweden
Website: https://storagecurve.com/