Building products company Quanex (NYSE: NX) reported Q2 CY2026 results exceeding the market’s revenue expectations, with sales up 1.3% year on year to $501.8 million. Its non-GAAP profit of $0.79 per share was 20.2% above analysts’ consensus estimates.
Is now the time to buy Quanex? Find out by accessing our full research report, it’s free.
Quanex (NX) Q2 CY2026 Highlights:
- Revenue: $501.8 million vs analyst estimates of $497.3 million (1.3% year-on-year growth, 0.9% beat)
- Adjusted EPS: $0.79 vs analyst estimates of $0.66 (20.2% beat)
- Adjusted EBITDA: $72.75 million vs analyst estimates of $68.02 million (14.5% margin, 7% beat)
- Operating Margin: 9.3%, up from -54.7% in the same quarter last year
- Free Cash Flow Margin: 9.5%, similar to the same quarter last year
- Market Capitalization: $861 million
“We stayed focused on managing our working capital during the third quarter of 2026, which when coupled with the seasonal uptick in volumes, enabled us to repay $42.25 million of debt and buy back some of our shares. We will continue to prioritize repaying debt and opportunistically repurchasing our shares as we generate cash in the fourth quarter of 2026. In addition, we will continue to identify operational efficiencies and commercial synergies that we believe will benefit us when consumer confidence and demand improve.”
Company Overview
Starting in the seamless tube industry, Quanex (NYSE: NX) manufactures building products like window, door, kitchen, and bath cabinet components.
Revenue Growth
A company’s long-term sales performance can indicate its overall quality. Any business can put up a good quarter or two, but the best consistently grow over the long haul. Thankfully, Quanex’s 12.5% annualized revenue growth over the last five years was excellent. Its growth beat the average industrials company and shows its offerings resonate with customers.
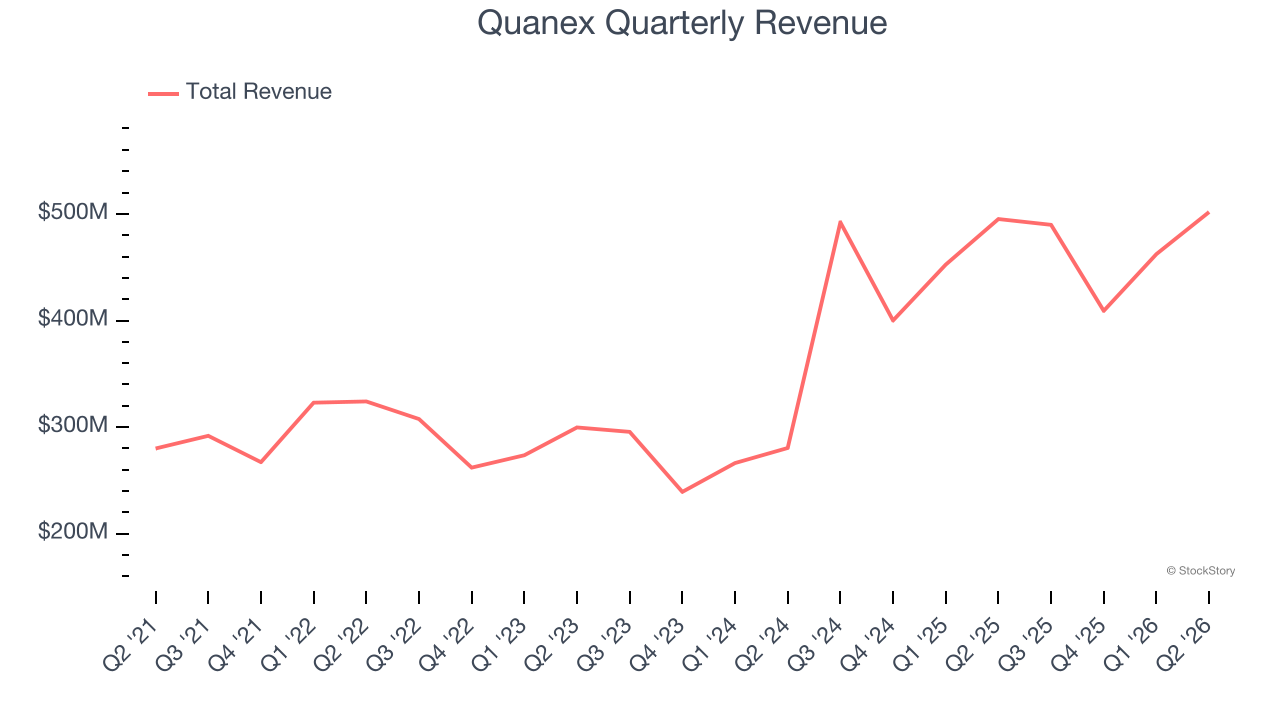
We at StockStory place the most emphasis on long-term growth, but within industrials, a half-decade historical view may miss cycles, industry trends, or a company capitalizing on catalysts such as a new contract win or a successful product line. Quanex’s annualized revenue growth of 31.3% over the last two years is above its five-year trend, suggesting its demand was strong and recently accelerated. 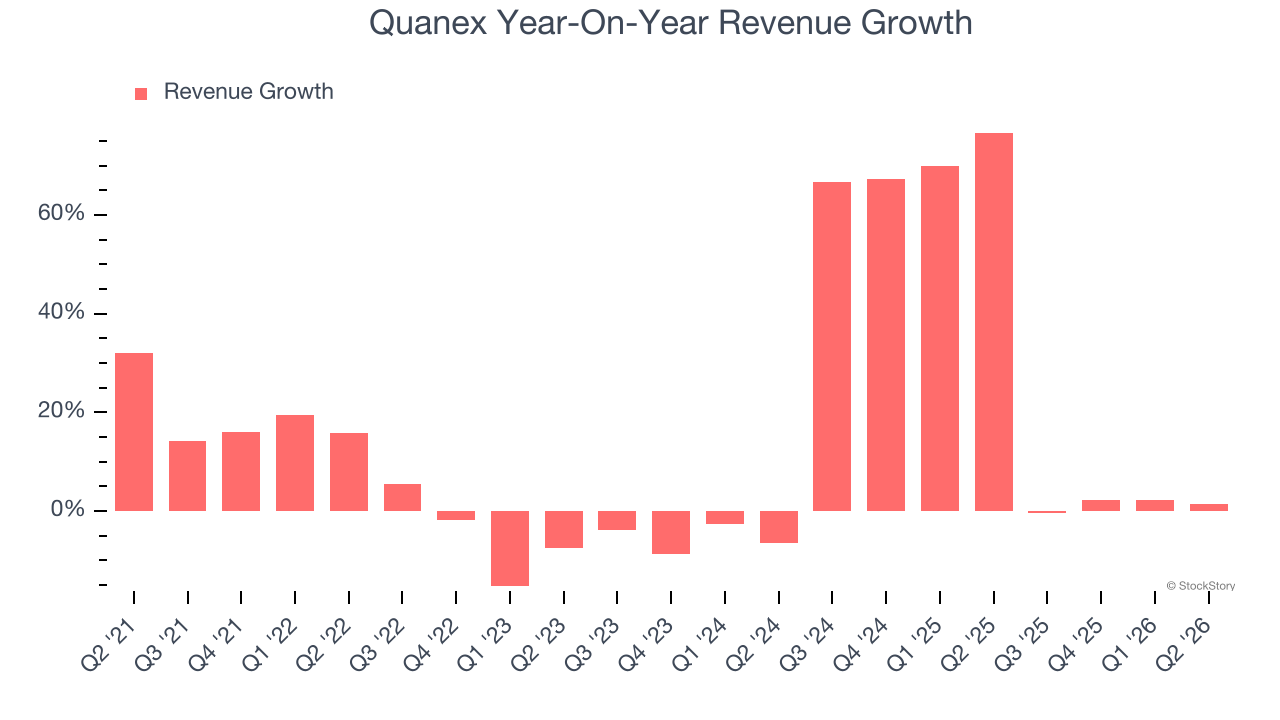
This quarter, Quanex reported modest year-on-year revenue growth of 1.3% but beat Wall Street’s estimates by 0.9%.
Looking ahead, sell-side analysts expect revenue to grow 1.3% over the next 12 months, a deceleration versus the last two years. This projection is underwhelming and implies its products and services will see some demand headwinds.
ALSO WORTH WATCHING: Nvidia’s Quiet Partner. Nvidia’s chips cost a hundred grand. The connectors that make them work cost even more. One company makes them all.
Every AI server needs specialized infrastructure the chip companies don’t make. High-speed cables. Power connectors. Thermal sensors. This 90-year-old company built a monopoly on it. The AI boom just started. This stock is still flying under the radar. Claim The Stock Ticker Here for FREE.
Operating Margin
Quanex was profitable over the last five years but held back by its large cost base. Its average operating margin of 2.5% was weak for an industrials business. This result isn’t too surprising given its low gross margin as a starting point.
Analyzing the trend in its profitability, Quanex’s operating margin decreased by 3.1 percentage points over the last five years. This raises questions about the company’s expense base because its revenue growth should have given it leverage on its fixed costs, resulting in better economies of scale and profitability. Quanex’s performance was poor no matter how you look at it - it shows that costs were rising and it couldn’t pass them onto its customers.
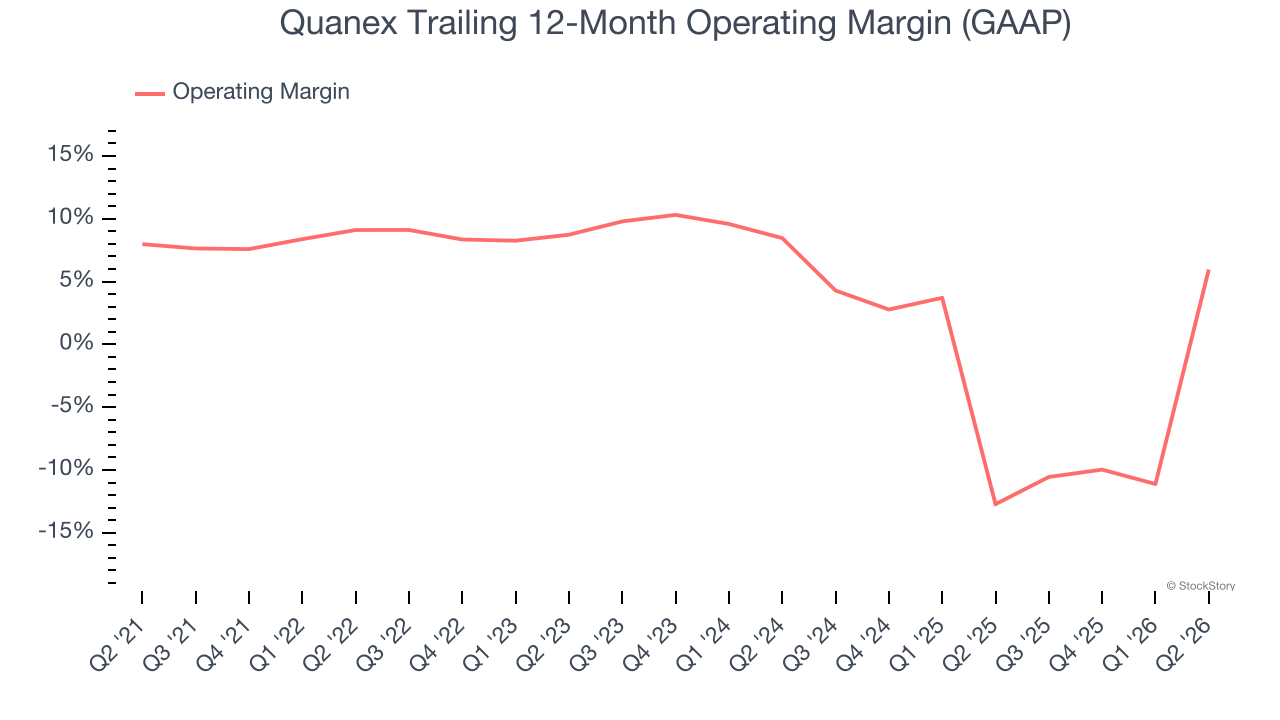
In Q2, Quanex generated an operating margin profit margin of 9.3%, up 63.9 percentage points year on year. The increase was solid, and because its operating margin rose more than its gross margin, we can infer it was more efficient with expenses such as marketing, R&D, and administrative overhead.
Earnings Per Share
Revenue trends explain a company’s historical growth, but the long-term change in earnings per share (EPS) points to the profitability of that growth — for example, a company could inflate its sales through excessive spending on advertising and promotions.
Quanex’s flat EPS over the last five years was below its 12.5% annualized revenue growth. However, its operating margin actually improved during this time, telling us that non-fundamental factors such as interest expenses and taxes affected its ultimate earnings.
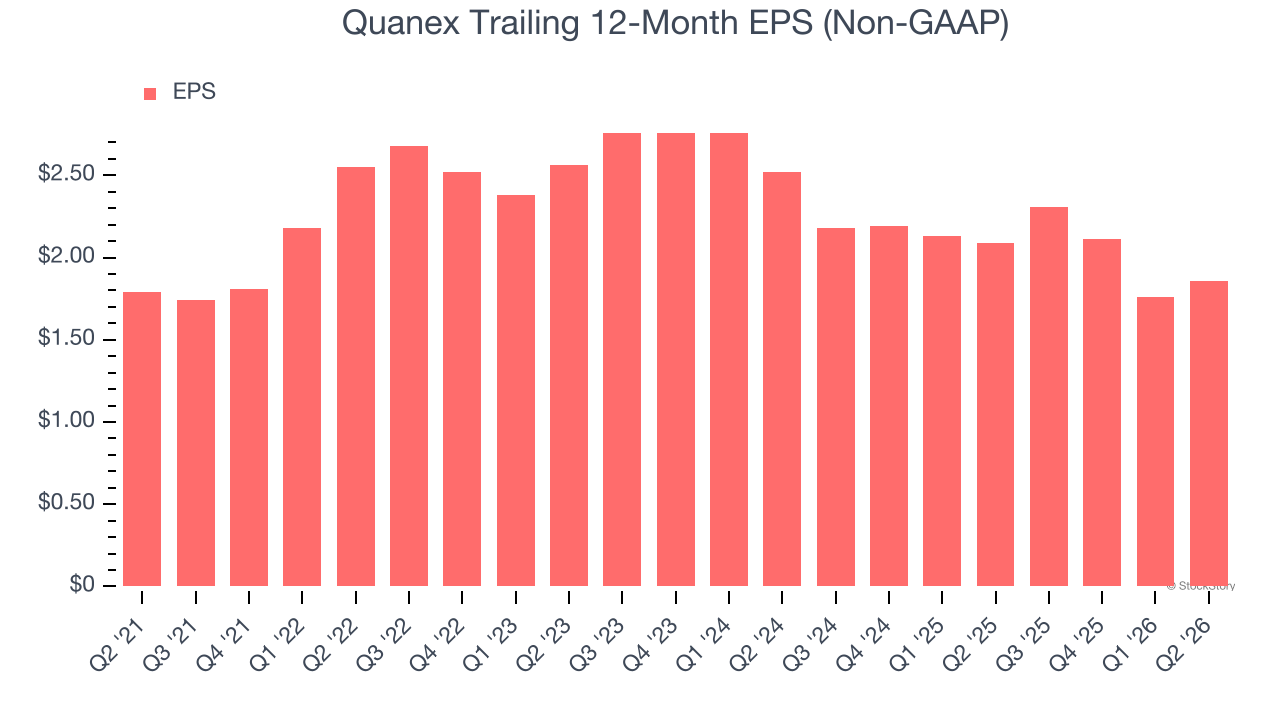
We can take a deeper look into Quanex’s earnings to better understand the drivers of its performance. As we mentioned earlier, Quanex’s operating margin expanded this quarter but declined by 3.1 percentage points over the last five years. Its share count also grew by 35.7%, meaning the company not only became less efficient with its operating expenses but also diluted its shareholders. 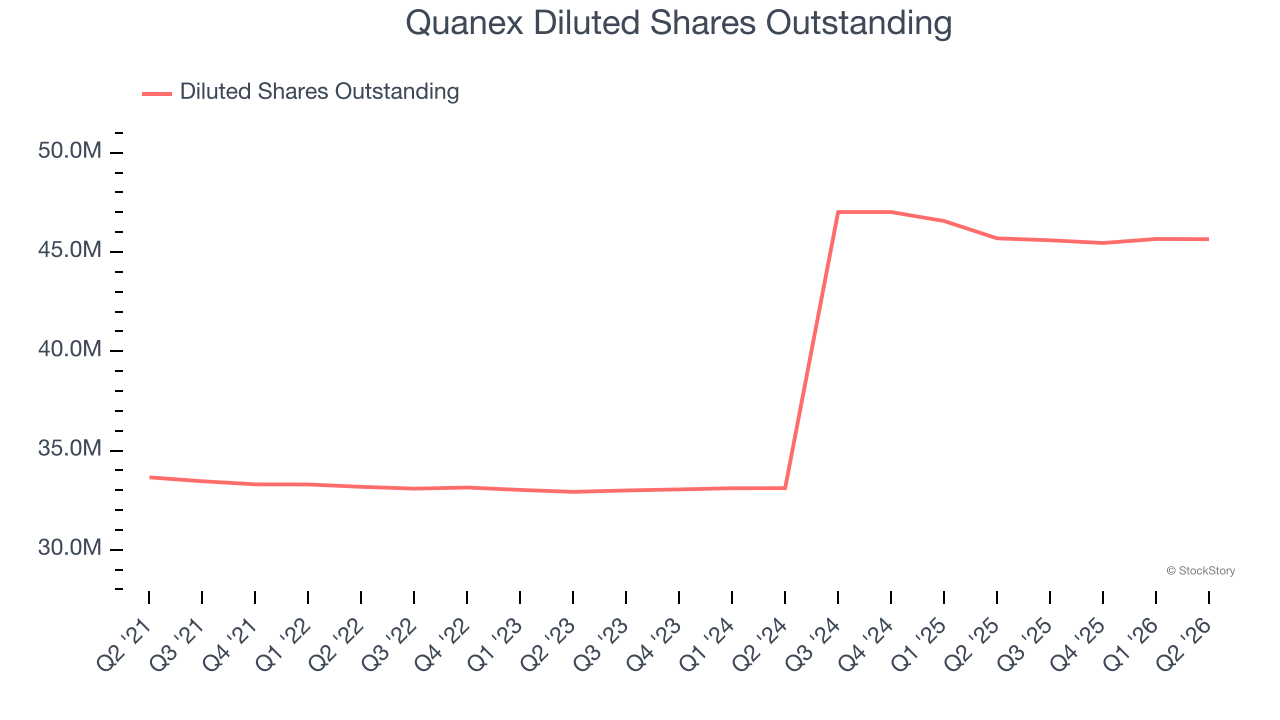
Like with revenue, we analyze EPS over a shorter period to see if we are missing a change in the business.
For Quanex, its two-year annual EPS declines of 14.1% show its recent history was to blame for its underperformance over the last five years. These results were bad no matter how you slice the data.
In Q2, Quanex reported adjusted EPS of $0.79, up from $0.69 in the same quarter last year. This print easily cleared analysts’ estimates, and shareholders should be content with the results. Over the next 12 months, Wall Street expects Quanex’s full-year EPS to grow 8.2% from $1.86 to $2.01.
Key Takeaways from Quanex’s Q2 Results
We enjoyed seeing Quanex beat analysts’ EBITDA expectations this quarter. We were also glad its EPS outperformed Wall Street’s estimates. Zooming out, we think this was a good print with some key areas of upside. The stock traded up 2.7% to $19.30 immediately following the results.
Indeed, Quanex had a rock-solid quarterly earnings result, but is this stock a good investment here? When making that decision, it’s important to consider its valuation, business qualities, as well as what has happened in the latest quarter. We cover that in our actionable full research report which you can read here (it’s free).