Integrated energy company Chevron (NYSE: CVX) reported revenue ahead of Wall Street’s expectations in Q3 2026, with revenue rising 36.3% year on year to $67.8 billion. Its non-GAAP profit of $5.28 per share was 8.5% above analysts’ consensus estimates.
For more on Chevron, read our free full research report.
Chevron (CVX) Q3 2026 highlights:
- Revenue $67.8 billion vs S&P analysts’ consensus estimates of $61.04 billion (36.3% year-on-year growth, 11.1% beat)
- Adjusted EPS $5.28 vs S&P analysts’ consensus estimates of $4.87 (8.5% beat)
- Operating margin 20.1%, up from 11.6% in the same quarter last year
- Free cash flow margin 17.7%, up from 9.9% in the same quarter last year
- Oil production in line with the same quarter last year
- Market capitalization $454 billion
“We’re reinvesting to bring more energy to a supply-constrained market,” Wirth continued. In Venezuela, Chevron’s joint ventures plan to invest $7 billion over the next five years, with the goal of generating low-cost, high-return and long-duration production growth. In the United States, the company signed agreements to reduce Bakken midstream costs by approximately 50 percent, strengthening the asset’s competitiveness. “Building on our performance this quarter, we're focused on delivering the reliable energy the world needs today, while positioning Chevron for the future,” Wirth concluded.
Revenue growth
A company’s long-term performance can give signals about its business quality. Even a bad business, especially in a cyclical industry, can perform well for a year or so, but a top-tier one should exhibit resilience through cycles. Over the last five years, Chevron grew its revenue at a decent 10.8% compounded annual growth rate. Its growth was slightly above the average energy upstream and integrated energy company and shows its offerings resonate with customers.
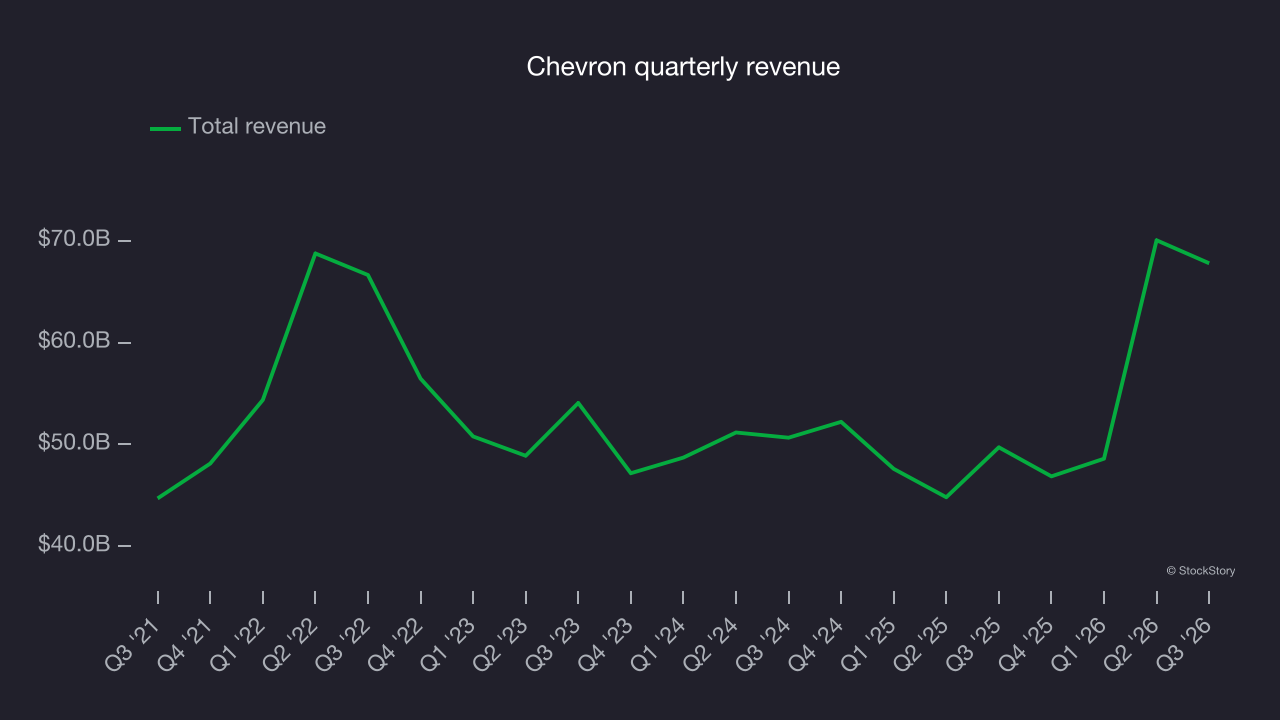
Even a long stretch in energy can be shaped by a single commodity cycle, so extending the view to ten years adds another perspective and reveals which companies are built to grow regardless of the pricing regime. Chevron’s annualized revenue growth of 7.6% over the last ten years is below its five-year trend, but the results were still good.
While looking at revenue is important, it can also introduce noise around commodity prices and M&A. Analyzing production, on the other hand, highlights what is happening inside the asset base and whether the economic footprint of a company is expanding. Over the last two years, Chevron’s oil production averaged 14.1% year-on-year growth while its natural gas production averaged 14.4% year-on-year growth. 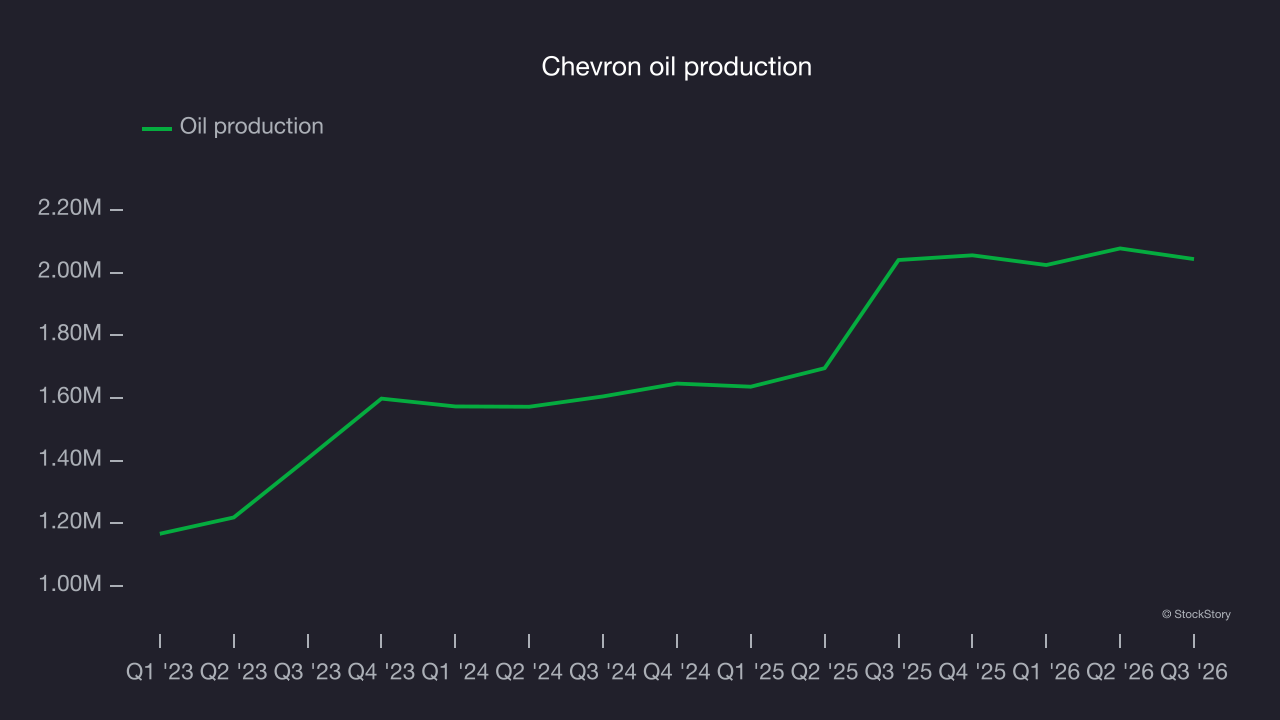
This quarter, Chevron reported strong year-on-year revenue growth of 36.3%, and its $67.8 billion of revenue exceeded Wall Street’s consensus estimates by 11.1%. Chevron also reported modest year-on-year oil production growth of 0.1%.
Adjusted EBITDA margin
Adjusted EBITDA margin strips out accounting distortions tied to depletion and historical drilling spend, providing a clearer view of the cash-generating power of the underlying asset base before financing and reinvestment decisions.
Chevron was profitable over the last five years but held back by its large cost base. Its average EBITDA margin of 25.3% was weak for an upstream and integrated energy business.
On the positive side, Chevron’s EBITDA margin rose by 1.2 percentage points over the last year, as its revenue growth gave it operating leverage.
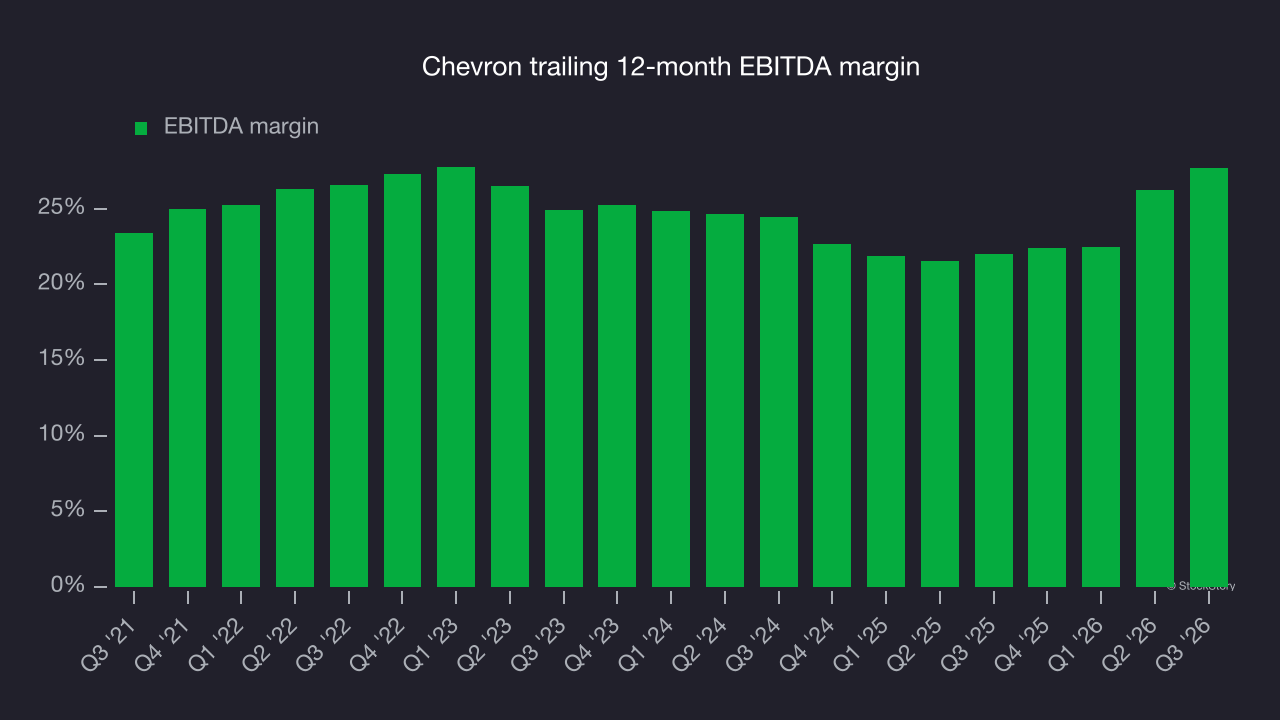
This quarter, Chevron generated an EBITDA margin of 29.3%, up 5.9 percentage points year on year. The increase was a positive sign of greater efficiency. Adjusted EBITDA fell short of Wall Street’s consensus estimates.
Free cash flow
Adjusted EBITDA shows how profitable a company’s existing “rock” is before financing and reinvestment, while free cash flow shows how much value remains after paying to replace those wells. Because production declines over time, strong EBITDA can coexist with weak FCF if drilling is expensive or declines are steep. FCF therefore captures both operating efficiency and the cost of sustaining production.
Chevron has shown strong cash profitability, giving it the option to reinvest or return capital to investors. The company’s free cash flow margin averaged 11.6% over the last five years, better than the broader energy upstream and integrated energy sector.
The level of free cash flow is important, but its durability across cycles is just as critical. Consistent margins are far more valuable than volatile swings driven by commodity prices.
Chevron’s ratio of quarterly free cash flow volatility to WTI crude price volatility over the past five years was 4.9 (lower is better), indicating strong insulation from commodity swings. This stability supports capital access in downturns and positions Chevron to act as a consolidator when weaker peers are forced to retrench.
Why use free cash flow to assess stability against commodity prices rather than compare Chevron’s revenue or EBITDA to WTI? What ultimately matters is not how much revenue or profit a company earns when prices are high but how much cash it can generate when prices are low. Free cash flow is the superior metric because it captures hedging effectiveness, growth and maintenance capex and management behavior during good times and bad.
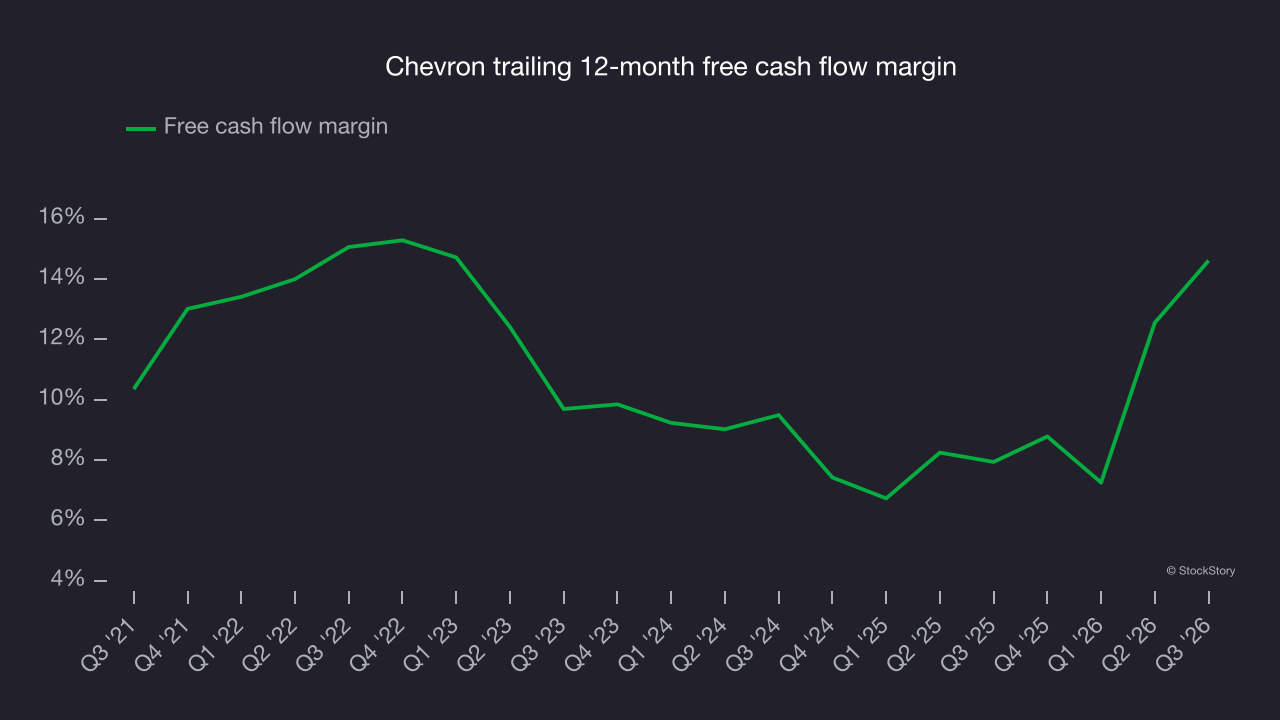
Chevron’s free cash flow totaled $12 billion in Q3, equivalent to a 17.7% margin. This was a positive result, as its margin was 7.8 percentage points higher than in the same quarter last year. Its cash profitability was also above its five-year level.
Key takeaways from Chevron’s Q3 results
Chevron delivered a solid quarter, with revenue well ahead of analysts’ consensus estimates and EPS also topping Wall Street’s estimates. Shares edged higher 1.6% to $235.02 immediately after the release.
Chevron had a solid quarter, but is the stock a buy? The latest quarter is only one piece of the longer-term business quality puzzle. Quality, when combined with valuation, can help determine if the stock is a buy. For more on Chevron, read our full research report here (it’s free).