Healthcare services company Chemed Corporation (NYSE: CHE) reported Q3 2026 results exceeding the market’s revenue expectations, with revenue up 10.6% year on year to $690.9 million. Its non-GAAP profit of $6.75 per share was 4.9% above analysts’ consensus estimates.
For more on Chemed, read our free full research report.
Chemed (CHE) Q3 2026 highlights:
- Revenue $690.9 million vs S&P analysts’ consensus estimates of $684.5 million (10.6% year-on-year growth, 0.9% beat)
- Adjusted EPS $6.75 vs S&P analysts’ consensus estimates of $6.44 (4.9% beat)
- Adjusted EBITDA $133.8 million vs analysts’ consensus estimates of $130.9 million (19.4% margin, 2.2% beat)
- Operating margin 14%, up from 12% in the same quarter last year
- Free cash flow margin 0.8%, down from 10.6% in the same quarter last year
- Sales volumes fell 99.1% year on year (2.5% in the same quarter last year)
- Market capitalization $6.68 billion
Revenue growth
A company’s long-term revenue performance is one signal of its overall quality. Any business can have short-term success, but a top-tier one grows for years. Over the last five years, Chemed grew its revenue at a mediocre 4.5% compounded annual growth rate, falling short of the healthcare sector benchmark.
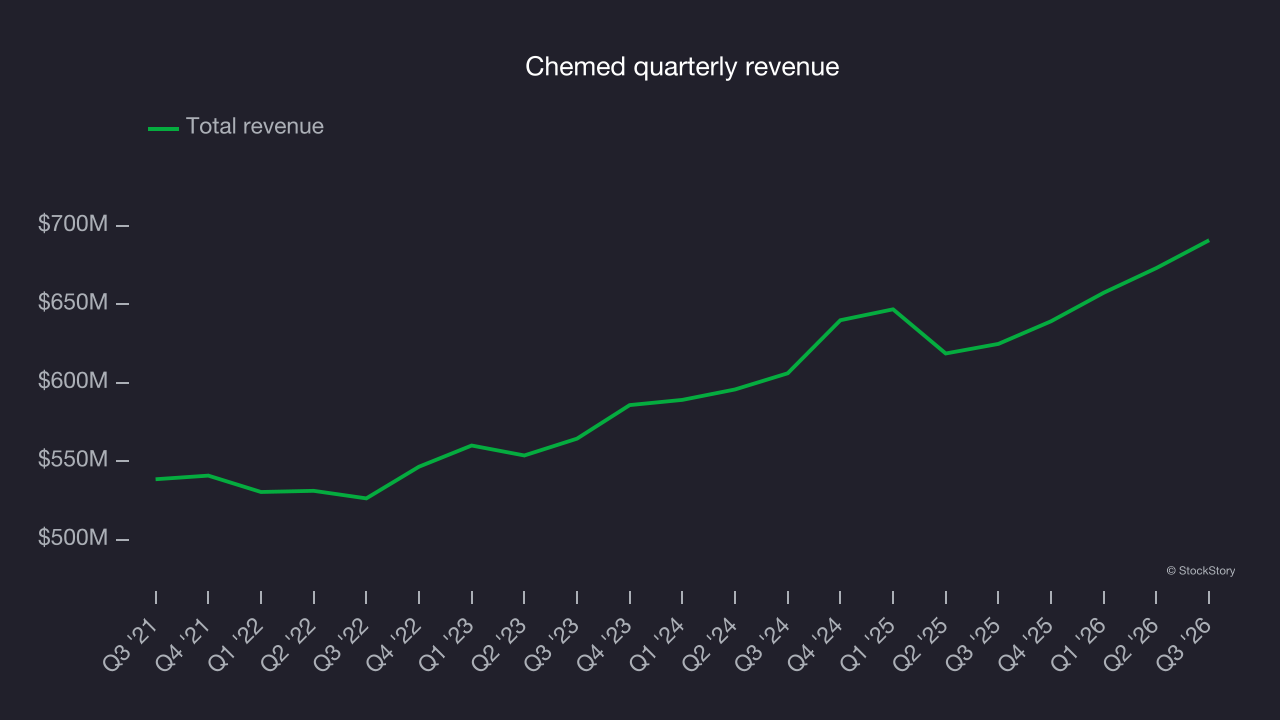
Long-term growth is the most important, but within healthcare, a half-decade historical view may miss new innovations or demand cycles. Chemed’s annualized revenue growth of 5.8% over the last two years is above its five-year trend, a positive sign. 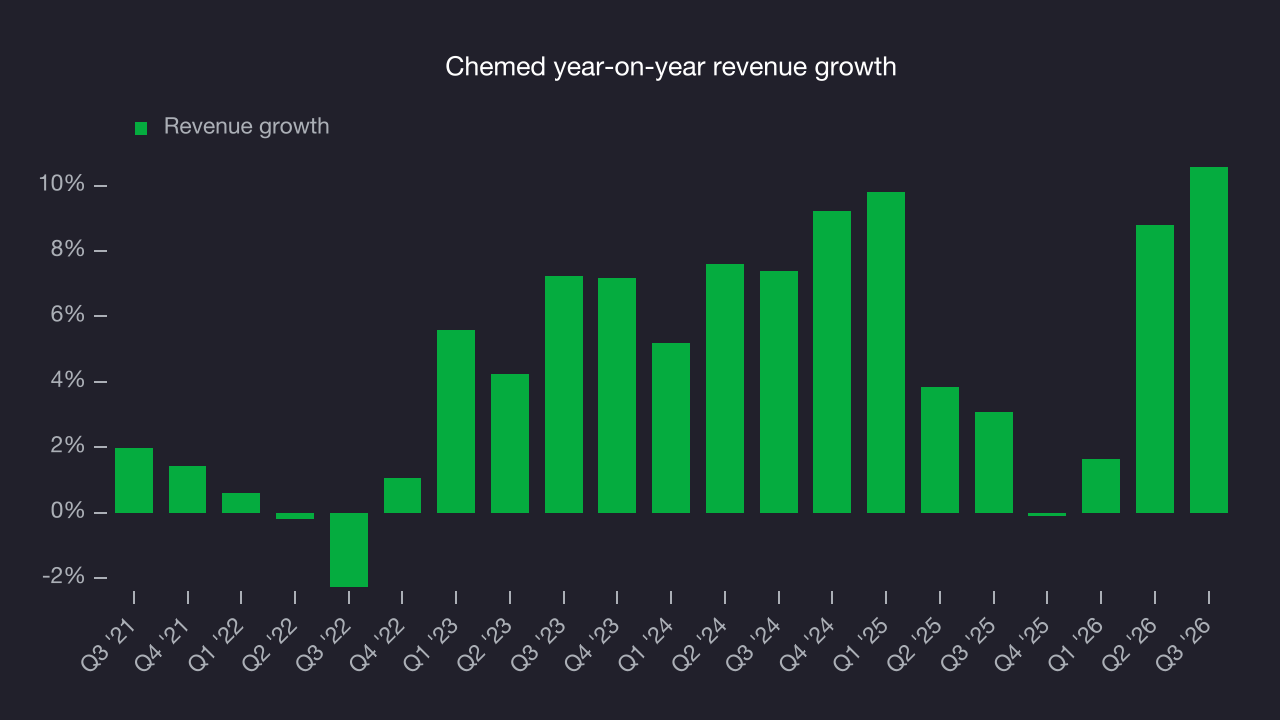
The company’s number of billable days, which reached 18,995 in the latest quarter, helps explain its revenue dynamics. Over the last two years, Chemed’s billable days averaged 6.8% year-on-year declines. Revenue growth outpaced this metric, indicating that the company benefited from price increases. 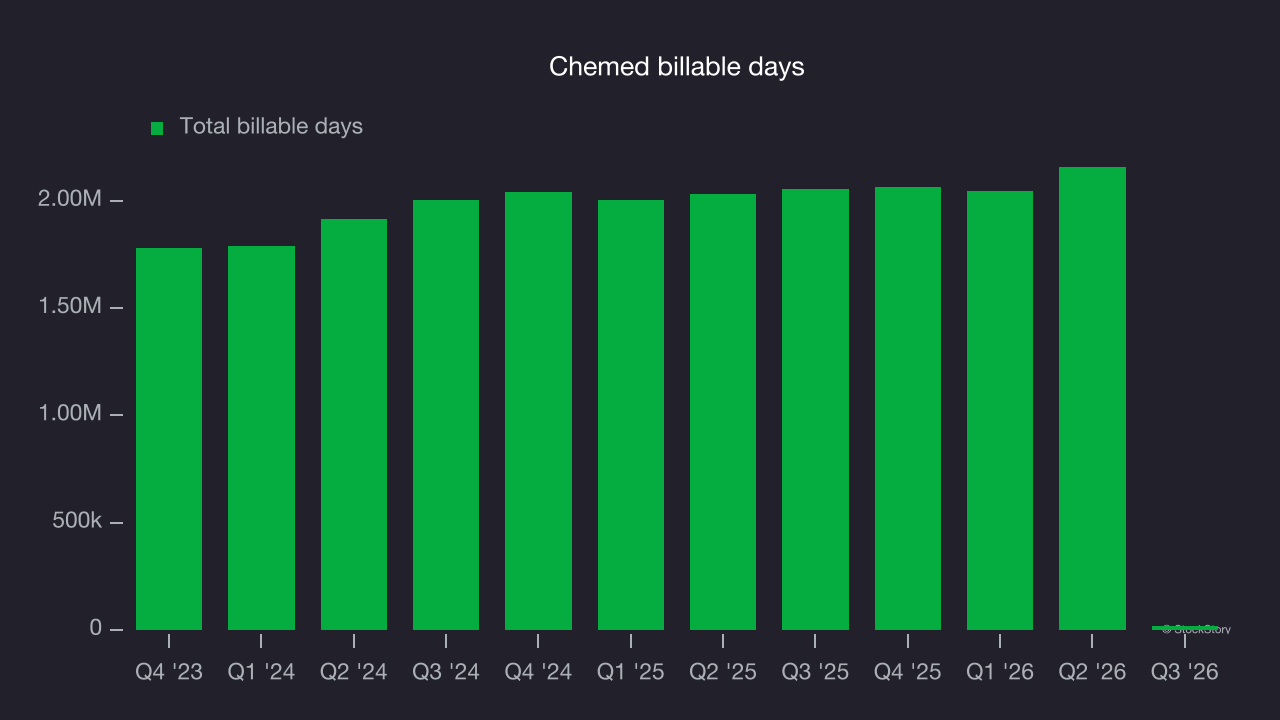
This quarter, Chemed reported year-on-year revenue growth of 10.6%, and its $690.9 million of revenue exceeded Wall Street’s consensus estimates by 0.9%.
Looking ahead, sell-side analysts expect revenue to grow 6.8% over the next 12 months, according to S&P, similar to its two-year rate. This projection is above the sector average and suggests its newer products and services will fuel better top-line performance.
Adjusted operating margin
Chemed has done a decent job managing its cost base over the last five years. The company has produced an average adjusted operating margin of 14.7%, higher than the broader healthcare sector.
Looking at the trend in its profitability, Chemed’s adjusted operating margin decreased by 3 percentage points over the last five years. The company’s two-year trajectory also shows it failed to get its profitability back to the peak as its margin fell by 1.4 percentage points. This poor performance shows its expenses were rising and it couldn’t pass those costs on to its customers.
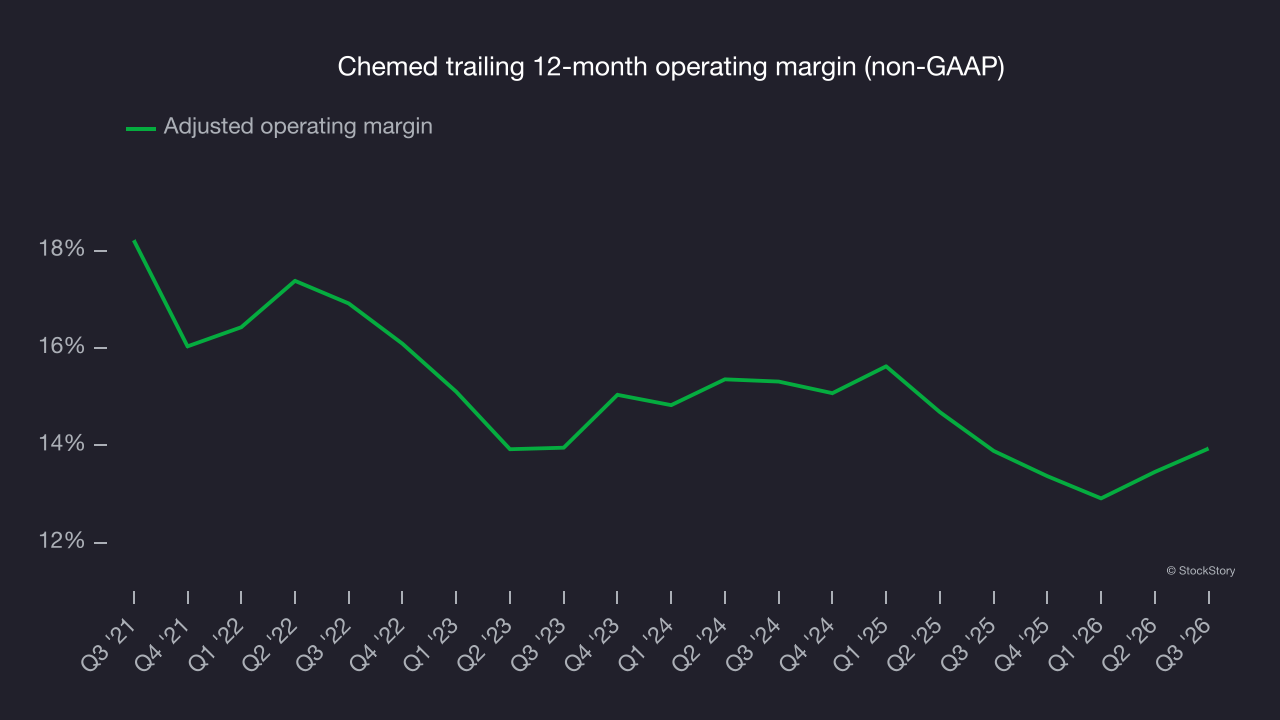
In Q3, Chemed generated an adjusted operating margin of 14%, up 2 percentage points year on year. The increase was a positive development and reflected greater efficiency.
Earnings per share
Revenue trends explain a company’s historical growth, but the long-term change in earnings per share (EPS) points to the profitability of that growth. For example, a company could inflate its revenue through excessive spending on advertising and promotions.
Chemed’s decent 5.3% annual EPS growth over the last five years aligns with its revenue performance, indicating it maintained its per-share profitability as it expanded.
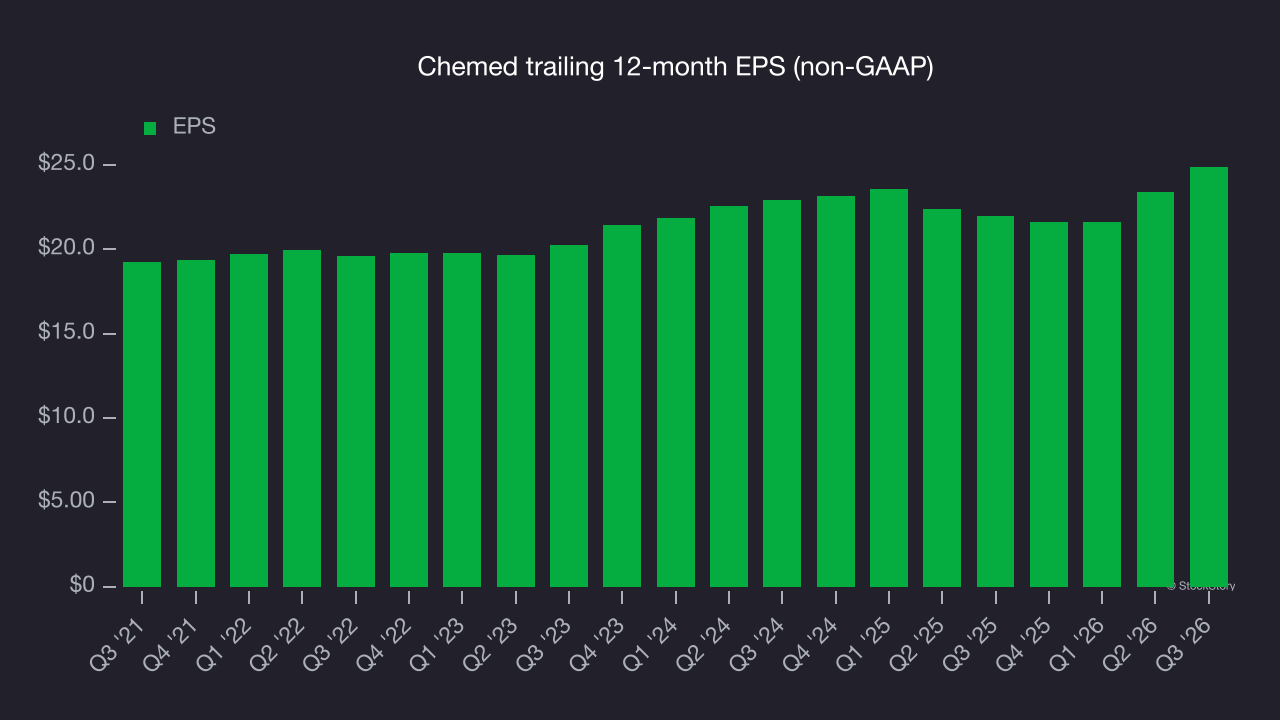
In Q3, Chemed reported adjusted EPS of $6.75, up from $5.27 in the same quarter last year. This result beat analysts’ consensus estimates by 4.9%. Over the next 12 months, Wall Street expects Chemed’s full-year EPS to grow 5.2% from $24.88 to $26.18, according to S&P.
Key takeaways from Chemed’s Q3 results
Chemed’s quarter had some key positives: EPS beat analysts’ consensus estimates, and revenue came in narrowly ahead of Wall Street’s consensus. Shares remained flat at $506.11 immediately after the results.
When deciding whether to buy the stock, it’s important to consider its valuation and business quality as well as what happened in the latest quarter. Read the full research report here (it’s free).