A lower herbicide bill can make AI weed detection look like an easy investment. But reducing chemical use and improving farm profitability are different achievements. A system must save enough on eligible applications to cover its equipment, software, service, and operating costs while maintaining effective weed control.
The ROI of AI weed detection therefore depends on the operation, not just the technology. Weed pressure, annual treated acreage, equipment compatibility, and application timing all influence the financial result. The strongest buying decision starts with a field-level budget and a controlled trial, rather than a headline savings percentage.
Where AI Weed Detection Creates Financial Value
AI weed detection uses image analysis to identify weeds and support more selective treatment. In real-time spraying systems, cameras scan the field and trigger individual nozzles or nozzle groups. In map-based workflows, imagery collected before application becomes a prescription that guides compatible spraying equipment. Both approaches aim to avoid treating areas where the targeted weeds are absent.
That distinction matters: detection creates information, but financial value depends on what the operator can do with it. A weed map that cannot be translated into a practical treatment decision has a different business case from a system that controls nozzles during an existing application.
For a spraying-focused investment, the clearest potential benefit is reduced expenditure on the herbicides applied selectively. Other benefits deserve consideration, but they should enter the budget only when the farm can document them.
For example, distinguish between:
- Chemical savings: the value of herbicide no longer applied.
- Operating savings: verified reductions in refill time, handling, labor, or other expenses.
- Agronomic outcomes: maintained weed control and crop performance.
- Information value: useful weed maps that support subsequent scouting or management decisions.
Do not assume these benefits arrive together. Applying less herbicide does not necessarily eliminate a field pass. If the sprayer still covers the same acreage, the budget should retain the costs of that travel unless the operating plan actually changes.
The investment question is therefore more precise than "How much chemical can this system save?" It is: "How much additional net value can this workflow deliver compared with our current program?"
What Field Evidence Shows, and What It Does Not
Field demonstrations show that substantial herbicide reductions are possible, but also that savings vary widely.
In a 2024 Iowa State University demonstration, a commercial real-time selective spraying system operated across five conventionally managed soybean fields totaling 415 acres. Reported herbicide savings ranged from 43.9% to 90.6%. The demonstration reported approximately $6,500 in chemical savings, or $15.70 per acre, while fields remained clean through canopy formation. Initial weed pressure was a major influence on the differences between fields.
Those results are useful evidence of opportunity, not a universal ROI benchmark. They describe particular soybean fields, a specific application, and the conditions of that season. The reported chemical savings are not net profit after equipment ownership, financing, subscriptions, maintenance, or additional labor.
A separate 2024 Iowa State demonstration evaluated a drone-mapping workflow followed by prescription spraying in soybeans. Across an 8.7-acre treatment area, it reported approximately 50% product savings and $13.42 per acre in chemical savings. The treatment showed no statistically significant yield difference from the broadcast comparison. That is encouraging, but the small demonstration does not establish equivalent performance across crops, regions, or seasons.
The practical lesson is that chemical savings should be treated as a variable to measure locally. A farm with patchy weed populations may have considerable untreated space available. A field with widespread weeds offers less opportunity to avoid spraying. In the five-field Iowa demonstration, stronger residual weed control was associated with lower weed pressure and greater savings during the subsequent selective application.
A purchase model should reflect that variability. Using the best-performing demonstration field as the base case can make an uncertain investment appear dependable.
How to Calculate the ROI of AI Weed Detection
Start with a comparison between the proposed workflow and the farm's actual alternative. That alternative might be an existing broadcast application, a contractor service, or a planned equipment replacement. It should not be an artificially expensive baseline selected to make the technology look attractive.
Define the Acres That Can Generate Savings
Count eligible applications, not simply total farm acreage.
An operation may farm substantial acreage but have only one application where its proposed detection system can reduce herbicide use. Another may have several suitable applications. Budget these as treated acre-passes, meaning one acre covered during one application.
For each eligible pass, record:
- Crop and treatment timing.
- Current herbicide cost per acre.
- Which products would be applied selectively.
- Which products or activities would remain unchanged.
- A conservative estimate of the avoidable chemical expenditure.
Keep application-level savings separate from whole-season savings. A large reduction in one post-emergence treatment is not the same as an equivalent reduction in the annual weed-management budget.
Calculate Annual Net Benefit
A practical planning equation is:
Annual net benefit = avoided chemical cost + other verified savings − additional annual operating costs
Additional costs should include applicable software charges, service fees, maintenance, training, data processing, extra labor, and any expected follow-up treatment.
For an upfront purchase, simple payback can then be estimated as:
Simple payback period = incremental upfront investment ÷ annual net benefit
Use incremental investment when comparing against an equipment purchase that would happen anyway. If the operation already plans to replace its sprayer, charging the entire replacement cost to weed detection would distort the comparison. Conversely, if adopting the technology requires replacing otherwise serviceable equipment, that additional commitment belongs in the decision.
Simple payback is a screening tool, not a complete investment appraisal. A longer-term comparison should also consider the timing of cash flows, financing, useful life, and resale assumptions. Avoid counting the same cost twice, such as subtracting the full purchase price and annual depreciation within the same calculation.
Test the Break-Even Workload
A useful threshold is:
Break-even annual treated acre-passes = annualized fixed technology cost ÷ net benefit per treated acre-pass before fixed cost
This calculation helps answer whether the farm has enough suitable work to support the investment.
Run at least three scenarios: conservative, expected, and favorable. Change weed pressure, chemical savings, eligible acreage, and operating costs. An investment that works only under the favorable scenario deserves more scrutiny than one that remains viable under cautious assumptions.
The Conditions That Can Strengthen or Weaken Returns
A sound financial model needs an equally sound operating model. Four factors deserve particular attention.
Weed Distribution and the Existing Herbicide Program
Selective spraying has more opportunity to avoid chemical use when weeds occupy a smaller share of the field. Dense, widespread infestations narrow that opportunity. The Iowa field demonstration illustrates this relationship clearly, with substantially different savings across fields using the same spraying platform.
Do not weaken a successful residual program merely to increase the apparent role of AI detection. In that demonstration, all five fields received pre-emergence residual herbicide programs, and the largest subsequent savings occurred where initial weed pressure was lowest. Selective post-emergence treatment complemented the earlier program rather than proving it unnecessary.
Detection Capability and Crop Conditions
Not all detection systems solve the same problem. "Green-on-brown" systems identify green vegetation against soil or residue. "Green-on-green" systems distinguish weeds from a growing crop. A capability suitable for a fallow field should not be assumed suitable for in-crop spraying.
Ask suppliers to demonstrate the intended crop, growth stage, weed spectrum, and operating conditions. Treat a broad accuracy claim as incomplete until its measurement is explained.
The relevant questions include how often target weeds are missed, how often non-target areas are treated, and whether the resulting application controls the weeds. Detection performance and agronomic success are related, but they are not interchangeable.
Sprayer Setup and Field Capacity
Selective spraying is an equipment workflow, not simply a camera installation. Iowa State's technical discussion identifies boom-height control, individual nozzle control, compatible nozzles, and management of changing spray demand as important implementation considerations. It also notes that operating-speed constraints depend on the system.
Obtain documented requirements for the specific configuration under consideration. Then evaluate acres completed per working day, including setup, calibration, cleaning, refilling, and troubleshooting.
Do not assume that less chemical automatically means lower labor costs. Measure the whole shift, especially when timely treatment is more valuable than maximum theoretical savings.
Weed-Control Quality and Follow-Up Costs
A detected weed still needs an effective treatment. Weed size, environmental conditions, spray coverage, additives, and herbicide resistance can all influence post-emergence control. Weeds may also emerge after an application.
That makes follow-up scouting part of the investment evaluation. If selective treatment requires additional rescue work, include the associated chemical, labor, machinery, and crop-access costs. Do not attribute a yield benefit to AI detection unless a suitable comparison supports it.
The governing principle is profitability, not the smallest possible sprayed area. A lower chemical bill has limited value if weed control becomes less reliable.
Compare the Workflow, Not Just the Hardware
Real-time detection and map-based prescriptions offer different ways to connect imagery with treatment. The appropriate choice depends on existing machinery, available staff, and how the farm organizes application work.
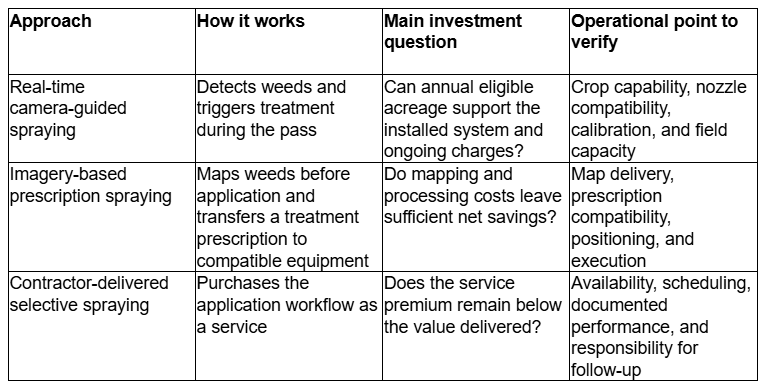
The first two workflows are demonstrated approaches to targeted spraying. A map-based method introduces a separate imaging and prescription stage, while a real-time system combines detection and application during the spraying pass.
For any ownership or service arrangement, request an itemized quote. Separate hardware, installation, recurring charges, support, training, and required upgrades. If a fee depends on acreage or usage, clarify exactly what triggers the charge.
Also establish who owns the application records and how they can be exported. For an investment justified by measured savings, usable records should be part of the purchasing specification.
Run a Pilot That Can Support a Purchase Decision
A useful pilot should test both treatment quality and economics under representative conditions. It should not be limited to the cleanest field or the easiest application window.
Agree on the evaluation method before treatment. Where practical, compare selective and conventional applications under similar crop, weed, and timing conditions. Record differences that could affect interpretation rather than assuming every outcome comes from the technology.
Capture four groups of information:
- Baseline conditions: weed species, distribution, crop stage, and recent weed-management history.
- Actual inputs: herbicide quantities, treated area, service charges, and operator time.
- Operational performance: field capacity, downtime, setup requirements, and interruptions.
- Agronomic results: surviving weeds, later escapes, follow-up treatments, and harvest outcomes where a meaningful comparison is available.
Reconcile application records with chemical inventory. A coverage map can help explain where spraying occurred, but the financial calculation should use actual product expenditure and operating costs.
Finally, update the budget using the pilot's measured results. Keep uncertain benefits outside the base case until they can be demonstrated. The purpose of a trial is not to confirm a preferred purchase, but to establish the conditions under which that purchase makes sense.
Make the Investment Earn Its Place
AI weed detection has a credible financial proposition: use better information to avoid unnecessary treatment while maintaining effective control. But a reduction in chemical use is the beginning of the business case, not its conclusion.
Before committing, request a documented assessment built around representative fields, eligible applications, full costs, and measurable weed-control outcomes. Compare ownership and service options using the same baseline. The right investment is the one that produces a defensible net return under the farm's working conditions, not the one with the most impressive savings claim.