At the core, the options arena operates as a market within a market — and with the contracts representing 100 shares of the underlying asset, they may offer tremendous upside potential. Of course, there’s no such thing as a free lunch, especially on Wall Street. While it’s true that, say a 3% move in the open market can sometimes yield a 100% payout in the options market or more, that upside doesn’t come free.
Obviously, such trades need to go according to plan for you to collect your outsized reward. However, the process isn’t easy because, unlike buying a garden-variety security, options force you into certain complexities:
- You must choose a specific price region (strike).
- You must choose a specific time window (expiration).
- You are exposed to non-linear payoffs.
- Error is not continuous but rather discrete.
Basically, options trading doesn’t allow room for much forgiveness. Usually, being “kind of right” is indistinguishable from being flat out wrong. Further, the difficult decisions regarding strike prices and expiration must be made well in advance of any prospective moves. Therefore, precision in the options market isn’t elective — it’s embedded in the instrument.
To better understand the environment we’re facing in the derivatives arena, I’ve been using a quantitative methodology via a hierarchical lens. Essentially, the idea is to break price action into discretized trials to uncover probabilistic behaviors based on frequency dynamics. In other words, consistent behaviors should create bulges in probability mass, which provide a beacon for potential trading targets.
To further improve this analysis, I have expanded this concept to create a three-dimensional chart called risk topography. Fundamentally, a topographic visualization preserves shape, asymmetry and voids. This last point is particularly important to determine where outcomes of specific quantitative signals are materializing the most.
It must be said that risk topography is not a standard metric in finance. However, I believe that once you recognize its utility, you will appreciate the higher dimensionality of analysis that it brings to the table.
JD.com (JD)
Chinese e-commerce giant JD.com (JD) has struggled throughout this year, with JD stock losing more than 15% on a year-to-date basis. Still, recent momentum suggests that a possible turnaround could be in the works. Notably, in the trailing five sessions, JD has gained roughly 3%. Interestingly, though, the latest implied volatility (IV) data suggests that the market is not anticipating that big of a swing in the weeks ahead.
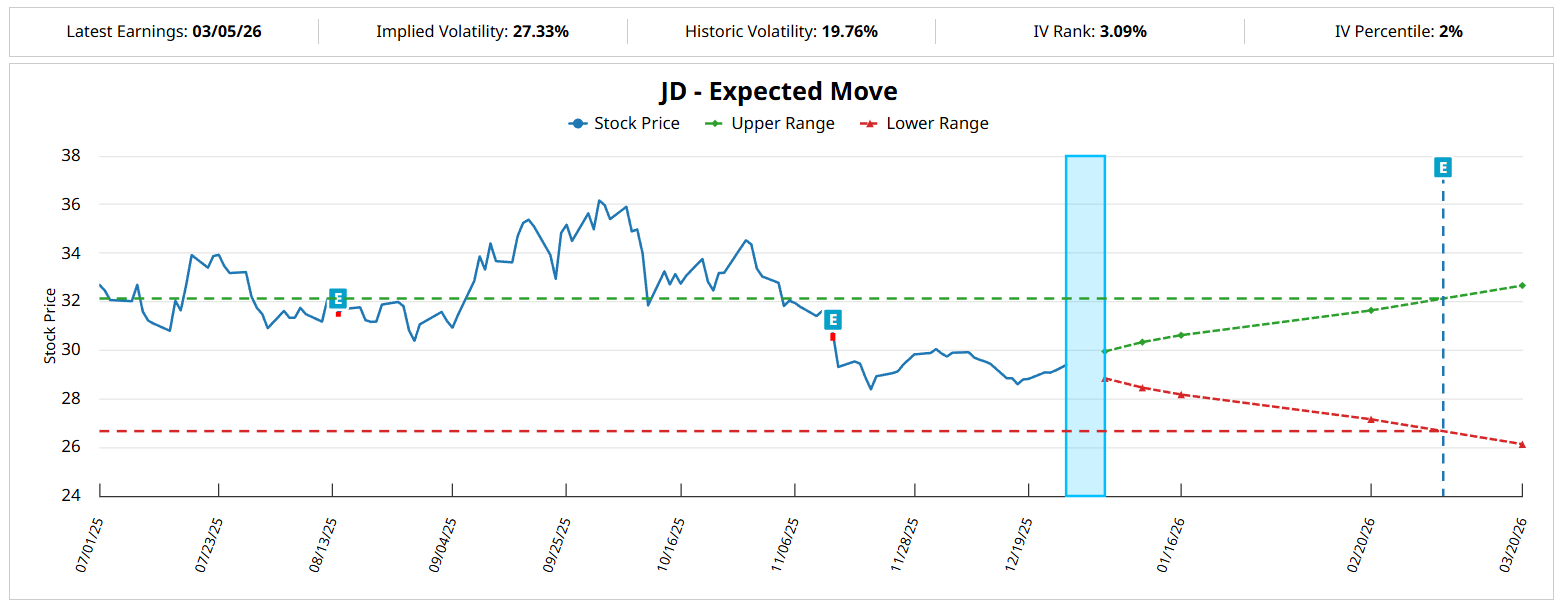
Barchart’s Expected Move calculator forecasts a range between $27.16 and $31.64 for the options chain expiring Feb. 20, 2026. Under aggregate conditions, 10-week returns for JD stock should usually land between $28.50 and $31, with price clustering occurring around $29.60 (assuming an anchor price of $29.40, Friday’s close).
However, the current quantitative signal for JD stock is the 3-7-D sequence. In the past 10 weeks, JD printed only three up weeks, leading to an overall downward slope. While seemingly pessimistic, under this setup, the forward 10-week returns would typically range between $27 and $33, with price clustering predominant just below $30.
Given this behavior trait, the 29/31 bull call spread expiring Feb. 20, 2026 may be most appealing for contrarian options traders. Using data provided by Barchart Premier, this transaction has the breakeven price set at $29.89, which is near where JD stock tends to cluster per the risk topography chart. At the same time, there’s some potential for heightened activity between $31 and $31.50.
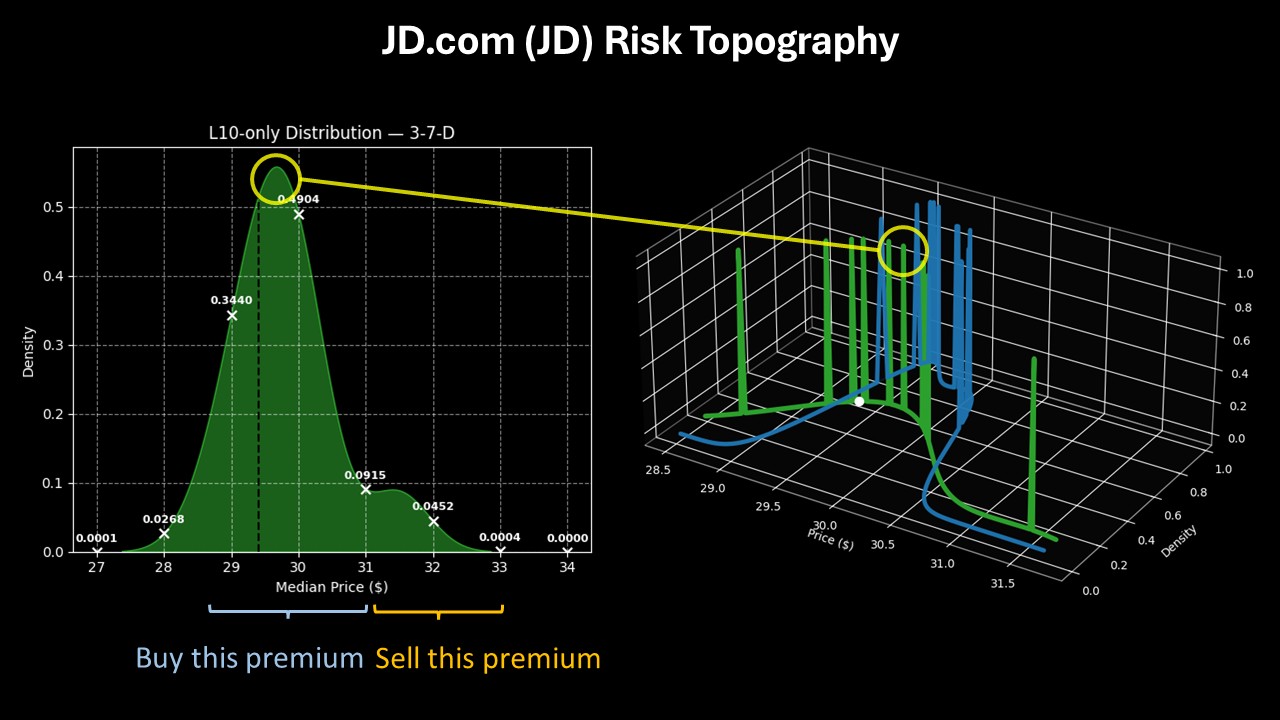
Ultimately, the 29/31 call spread offers a decent chance of not losing money while also fighting for the $31 strike, which would trigger a maximum payout of nearly 125%.
NetApp (NTAP)
Data infrastructure specialist NetApp (NTAP) is another name that hasn’t exactly performed well this year. Since the January opener, NTAP stock has slipped nearly 5%. It’s not a terrible performance but it’s not exactly encouraging either. Barchart’s Technical Opinion indicator rates shares as a Hold — not an unfair assessment when viewing the overall pricing dynamics.
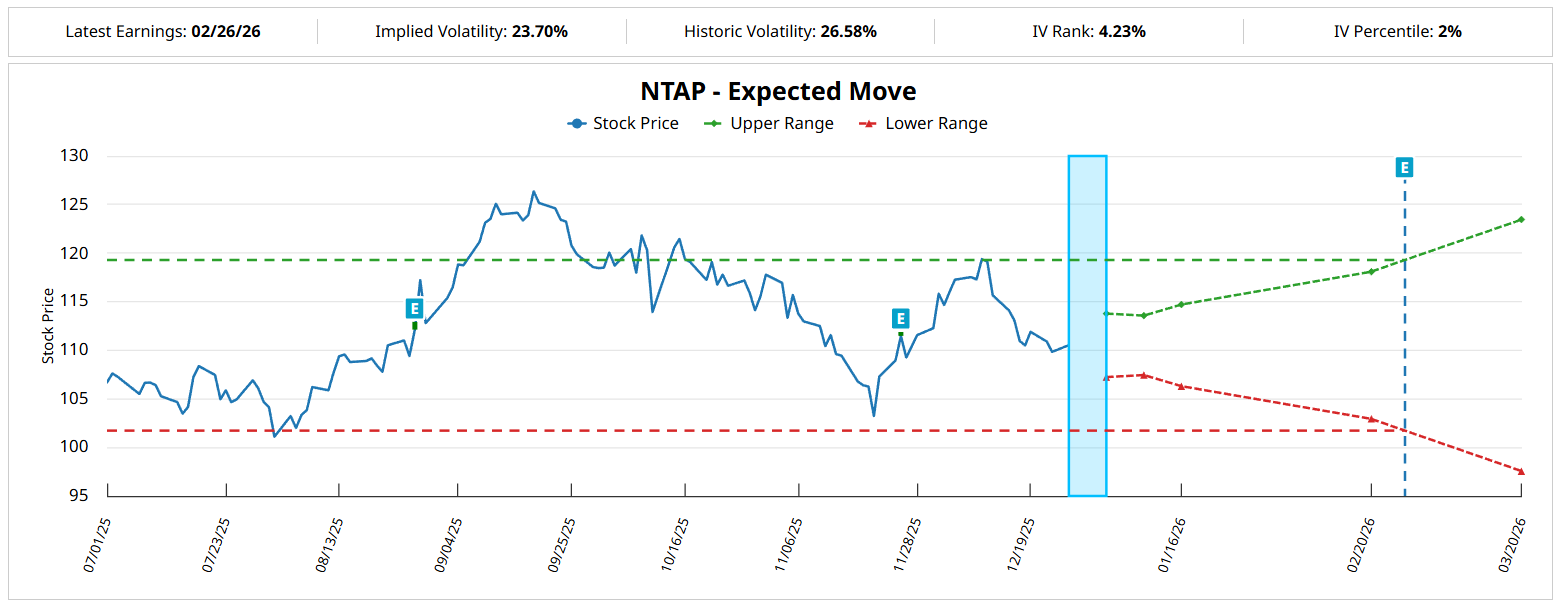
Based on IV levels, the market isn’t anticipating a huge move from NTAP stock. Per Barchart’s Expected Move calculator, NTAP could land between $102.95 and $118.08 for the options chain expiring Feb. 20, 2026. From a quantitative perspective, aggregate conditions would place NTAP’s 10-week returns between $109 and $115, with price clustering likely to occur around $112 (assuming an anchor price of $110.51).
However, the current quantitative signal is the 3-7-D sequence. Under this setup, the forward 10-week returns of NTAP stock would be expected to range between $100 and $135, with price clustering likely to be predominant at approximately $120.
Looking at risk topography, peak density doesn’t actually show up at $120 exactly — that’s more of an approximate field using kernel density estimation (calculus). In reality, price behaviors tend to cluster between $120 and $122.50. That actually makes the 115/120 bull call spread expiring Feb. 20 very attractive.
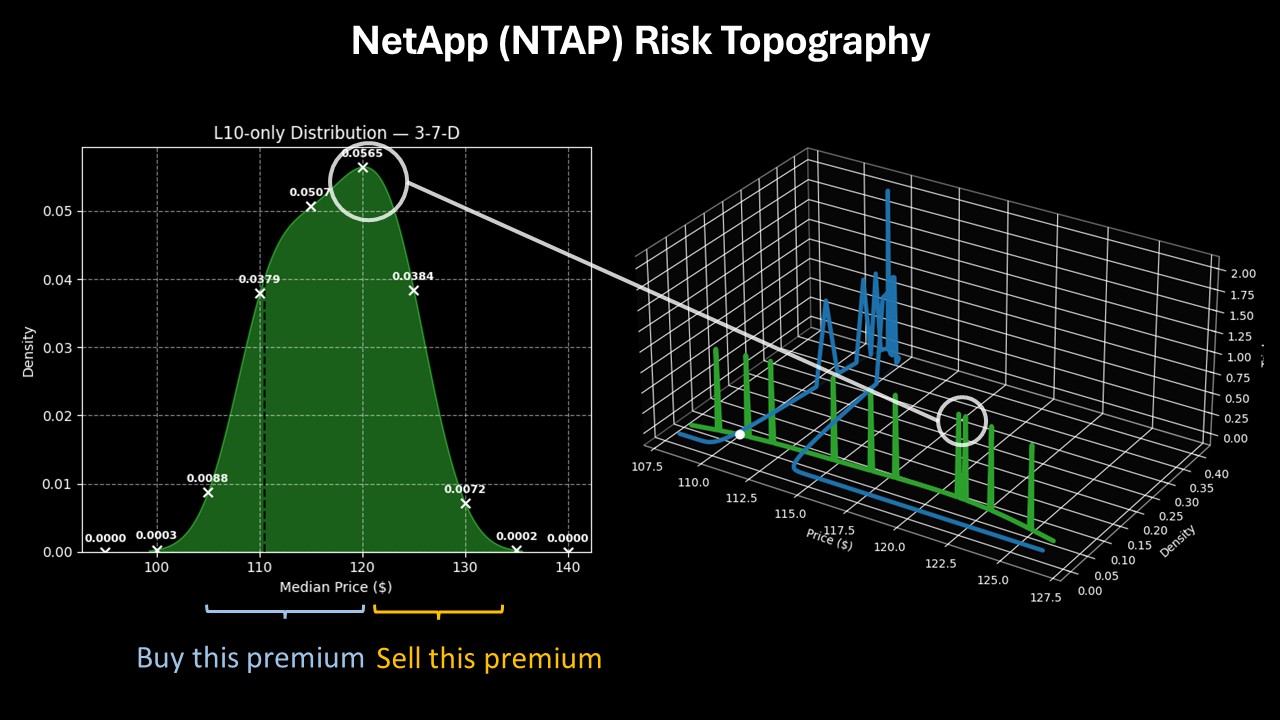
If NTAP stock rises through the $120 strike at expiration — which would appear to be in play — the maximum payout would be 150%.
Zscaler (ZS)
Among the securities on this list, Zscaler (ZS) represents the clear outperformer, gaining nearly 28% since the start of the year. At the same time, it has suffered some big losses recently. In the trailing month, ZS stock slipped more than 8%. In the past half-year period, the security is down 27%.
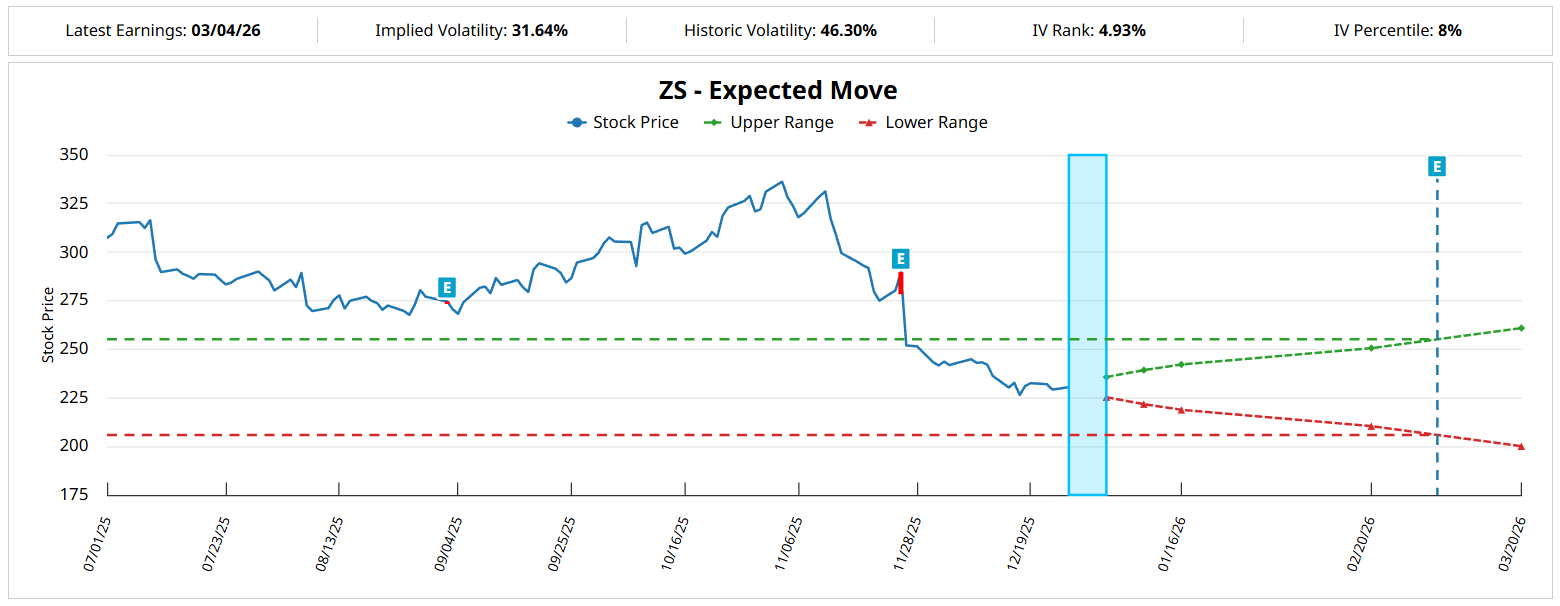
Based on the latest IV data, the market anticipates a sizable swing in ZS stock. Barchart’s Expected Move calculator reports a possible range between $210.48 and $250.56 for the Feb. 20 options chain. From a quantitative view, aggregate data suggests that Zscaler’s 10-week returns would likely range between $225 and $255, with price clustering occurring at $237.50.
However, the current quant signal is the 2-8-D sequence. Under this sell-heavy sequence, the forward 10-week returns would likely range between $212 and $270, with price clustering predominant at around $238. Using risk topography, though, we can see heightened activity at $250, which provides an intriguing idea for a bullish trade.
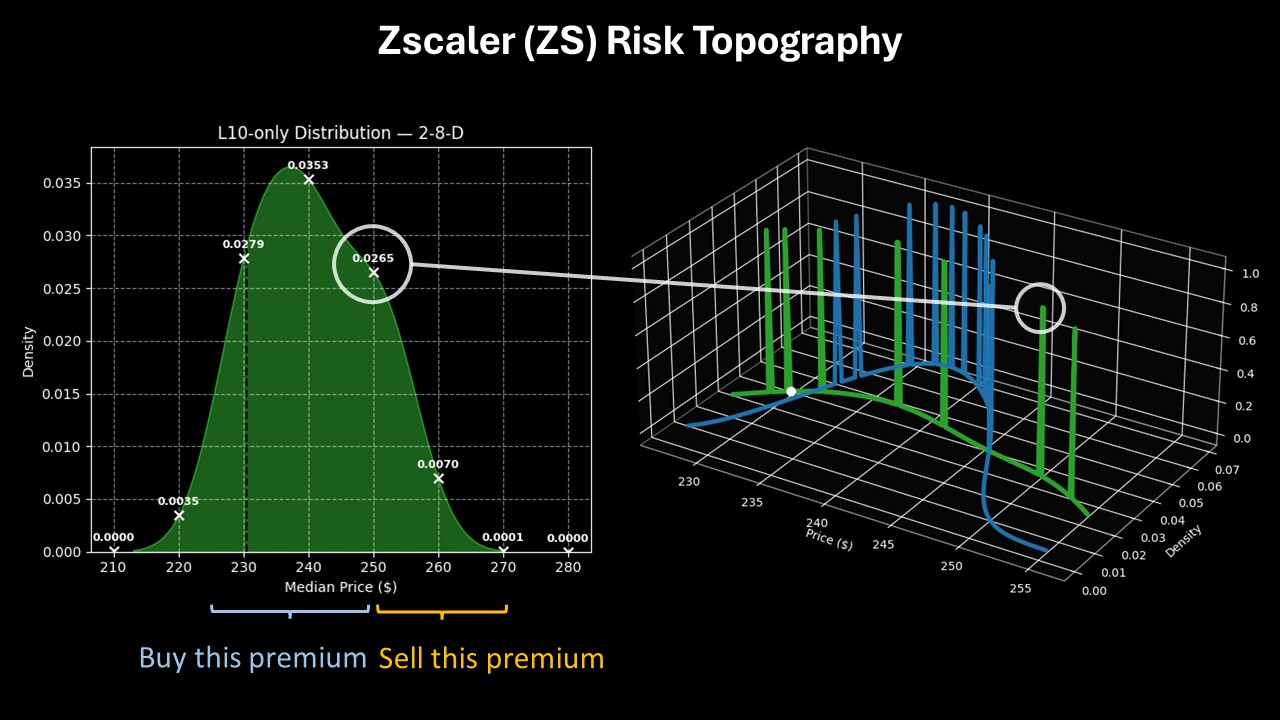
For the boldest speculators, they may consider the 240/250 bull spread expiring Feb. 20. This trade features a breakeven price at $243.60, which makes the wager more probabilistically palatable. However, the length of the second leg of the transaction allows traders to reach for $250, which would trigger a max payout of nearly 178%.
On the date of publication, Josh Enomoto did not have (either directly or indirectly) positions in any of the securities mentioned in this article. All information and data in this article is solely for informational purposes. For more information please view the Barchart Disclosure Policy here.
More news from Barchart
- The Saturday Spread: Using Risk Topography to Plan Your Options Strategies (JD, NTAP, ZS)
- Tesla + Robinhood + FedEx’s Unusually Active Put Options Could Deliver $Big Income Over the Next 30 Days
- Cisco Systems Stock Is Treading Water - How to Use Puts and Calls to Play CSCO
- Here’s a Smart Way to Trade Robinhood (HOOD) Stock Without Going into Lottery Mode