

As we approach year-end, the Nasdaq is showing multi-year strength driven by several key factors. The Federal Reserve's ongoing interest rate cuts are making borrowing cheaper, encouraging corporate investment and consumer spending that directly benefit equity markets. AI enthusiasm remains a powerhouse, pushing earnings growth and heavy investments in tech giants that dominate the index. Add strong consumer spending, fueled by a solid economy and the holiday season rush, and continued corporate earnings expansion in the tech sector, and the foundation for Nasdaq gains looks solid heading into the new year.
That said, headwinds could emerge to test this rally. High valuations in many tech stocks leave them vulnerable if growth falls short of expectations. Economic uncertainty lingers with potential trade tensions, new tariffs, or a cooling labor market. Plus, the Nasdaq's heavy reliance on a handful of mega-cap tech names creates concentration risk, where any stumble in those leaders could spark broader volatility.
Nasdaq Technical Picture
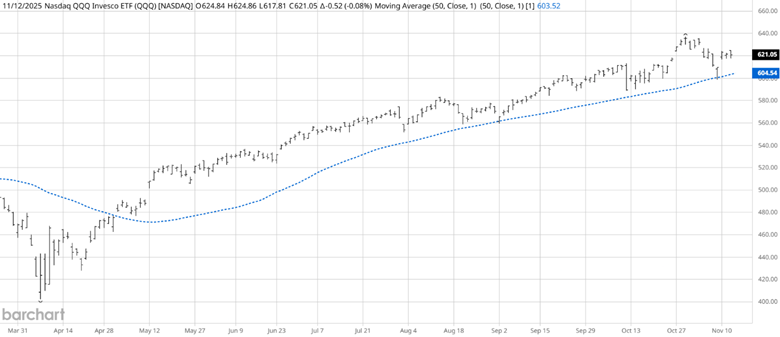
Source: Barchart
Will the Nasdaq market deliver another award-winning year? Currently, the Nasdaq is up 54% year-to-date. This, coming on the heels of a 26% return in 2024. Since April 2025, the Nasdaq has rallied about 59% with no measurable corrections. The 50-day simple moving average (SMA) has kept the April rally alive, with just five retests of the SMA. Many market participants argue that the Nasdaq is overextended and ready for a significant correction. While those opinions have been expressed multiple times in the past, the Nasdaq has continued to defy the top pickers. The trend has shown little, if any, signs of turning down. Investors and traders should always have a plan that alerts them when they feel the trend is changing and then act accordingly. Failure to have an exit plan is why so many traders end up as buy-and-hold investors.
The Seasonal and Correlation Outlook for the Nasdaq
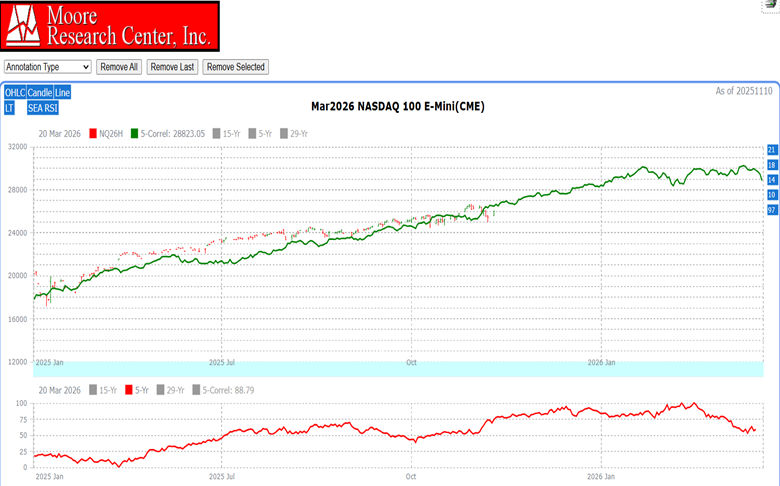
The December Nasdaq futures contract will rollover to the March contract in the coming weeks. Looking at the March Nasdaq futures, we can see the significant 5-year correlation (green). Those years and percentages are 1997 (87%), 2010 (91%), 2014 (91%), 2018 (91%), and 2021 (92%). Overlaying the correlation and projecting into the future can give us some insight into the past and possibly create a path for the future. There are no guarantees this will happen, but it does give us a roadmap to help plan for the future. From the current date of mid-November, we can see that the correlation is showing a steady uptrend into the year-end.
The 5-year seasonal (red) pattern shows that the Nasdaq's 4th quarter has finished higher than the 3rd quarter on average. The 5-year pattern is interesting because it aligns with the market shock caused by the pandemic.
Nasdaq seasonality and multi-year correlation patterns have historically pointed to year-end strength, but they're no guarantee—markets can defy the script. These are guidelines, not certainties. When current trends and fundamentals align with these seasonal and cyclical tendencies, it creates a powerful tailwind, giving price momentum an extra boost as the year closes.
Assets to Trade the Nasdaq Market
- Standard Size Futures: Nasdaq-100 futures (NQ), traded on CME, contract size $20 x Nasdaq-100 Index.
- Micro Size Futures: Micro E-mini Nasdaq-100 futures (NM), traded on CME, contract size $2 x Nasdaq-100 Index.
- ETFs: Invesco QQQ Trust (QQQ), tracks the Nasdaq-100 Index; leveraged ETFs like ProShares UltraPro QQQ (TQQQ) or inverse ETFs like ProShares Short QQQ (PSQ).
- Options: Options on Nasdaq-100 futures (NQ), Micro E-mini Nasdaq-100 futures (NM), or ETFs like QQQ.
- Individual Stocks (Closely Correlated): Stocks like Apple (AAPL), Microsoft (MSFT), Amazon (AMZN), Nvidia (NVDA), and Meta (META), which are heavily weighted in the Nasdaq-100 (combined weight approximately~40%)
The major stock indexes—Nasdaq-100, S&P 500, Dow Jones Industrial Average, and Russell 2000—exhibit high correlation, with historical daily correlations between Nasdaq-100 and S&P 500 averaging 0.90-0.95 over the past decade. This tight relationship means the Nasdaq's upcoming seasonal upward bias in the 4th quarter will likely influence these other indexes to varying degrees, depending on sector differences. Traders should expect coordinated moves across these markets, with potential choppiness from possible year-end headwinds for the Nasdaq.
Other Stock Indexes:
- S&P 500 futures: ES or ET
- Dow Jones Industrial Average futures: YM or YR
- Russell 2000 futures: QR or RX
In Closing…..
As the Nasdaq heads into year-end, it continues a remarkable multi-year run, up 54% year-to-date after a 26% gain in 2024, with a 59% rally since April 2025 showing almost no meaningful pullbacks. Strength is rooted in Federal Reserve rate cuts that ease borrowing and spur investment, surging AI-driven earnings in dominant tech names, robust consumer spending amid a solid economy and holiday momentum, and steady corporate profit growth. Technicals remain firmly bullish, with the 50-day SMA acting as reliable support through just five retests, while skeptics calling for a correction have been repeatedly proven wrong as the trend stays intact.
Yet risks loom: elevated tech valuations offer little margin for error, economic uncertainty from trade tensions or a softening labor market could weigh on sentiment, and heavy concentration in a few mega-caps heightens the potential for volatility. Seasonality and five-year correlation patterns—aligned with strong years like 1997, 2010, 2014, 2018, and 2021—point to typical Q4 upside, but these are guidelines, not promises. When fundamentals and trends align with these historical tendencies, however, they create tailwinds for price action. Traders can access the move through NQ or micro NM futures, QQQ or leveraged ETFs, options, or core holdings like Apple, Microsoft, and Nvidia, while noting the Nasdaq's tight correlation with the S&P 500, Dow, and Russell 2000 often drives broader index coordination.
On the date of publication, Don Dawson did not have (either directly or indirectly) positions in any of the securities mentioned in this article. All information and data in this article is solely for informational purposes. For more information please view the Barchart Disclosure Policy here.
More news from Barchart
- Warren Buffett Says Investors Should Measure Their Investing Success On ‘Slugging Percentage, Not Batting Average’
- Oklo Is ‘Setting the Stage’ for a Revolution in Nuclear Energy. Should You Buy OKLO Stock Here?
- This Semiconductor Stock Just Got a New Street-High Price Target. Should You Buy It Now?
- Nasdaq Year-End Playbook Decode 5-Year Correlations and Seasonal Q4


