Proppant sand producer Atlas Energy Solutions (NYSE: AESI) announced better-than-expected revenue in Q2 CY2026, with sales up 1.6% year on year to $293.2 million. Its GAAP loss of $0.20 per share was 21.2% below analysts’ consensus estimates.
Is now the time to buy Atlas Energy Solutions? Find out by accessing our full research report, it’s free.
Atlas Energy Solutions (AESI) Q2 CY2026 Highlights:
- Revenue: $293.2 million vs analyst estimates of $284.3 million (1.6% year-on-year growth, 3.1% beat)
- EPS (GAAP): -$0.20 vs analyst expectations of -$0.16 (21.2% miss)
- Adjusted EBITDA: $49.51 million vs analyst estimates of $48.86 million (16.9% margin, 1.3% beat)
- Operating Margin: -7.7%, down from 2.5% in the same quarter last year
- Free Cash Flow Margin: 11.9%, down from 16.8% in the same quarter last year
- Market Capitalization: $1.35 billion
Company Overview
Building the world's first long-haul proppant conveyor system to reduce truck traffic, Atlas Energy Solutions (NYSE: AESI) mines and processes sand used as proppant to prop open fractures in oil and gas wells during hydraulic fracturing.
Revenue Growth
A company’s long-term performance can give signals about its business quality. Even a bad business, especially in a cyclical industry, can shine for a year or so, but a top-tier one should exhibit resilience through cycles. Luckily, Atlas Energy Solutions’s sales grew at an incredible 51.1% compounded annual growth rate over the last five years. Its growth beat the average energy upstream and integrated energy company and shows its offerings resonate with customers.
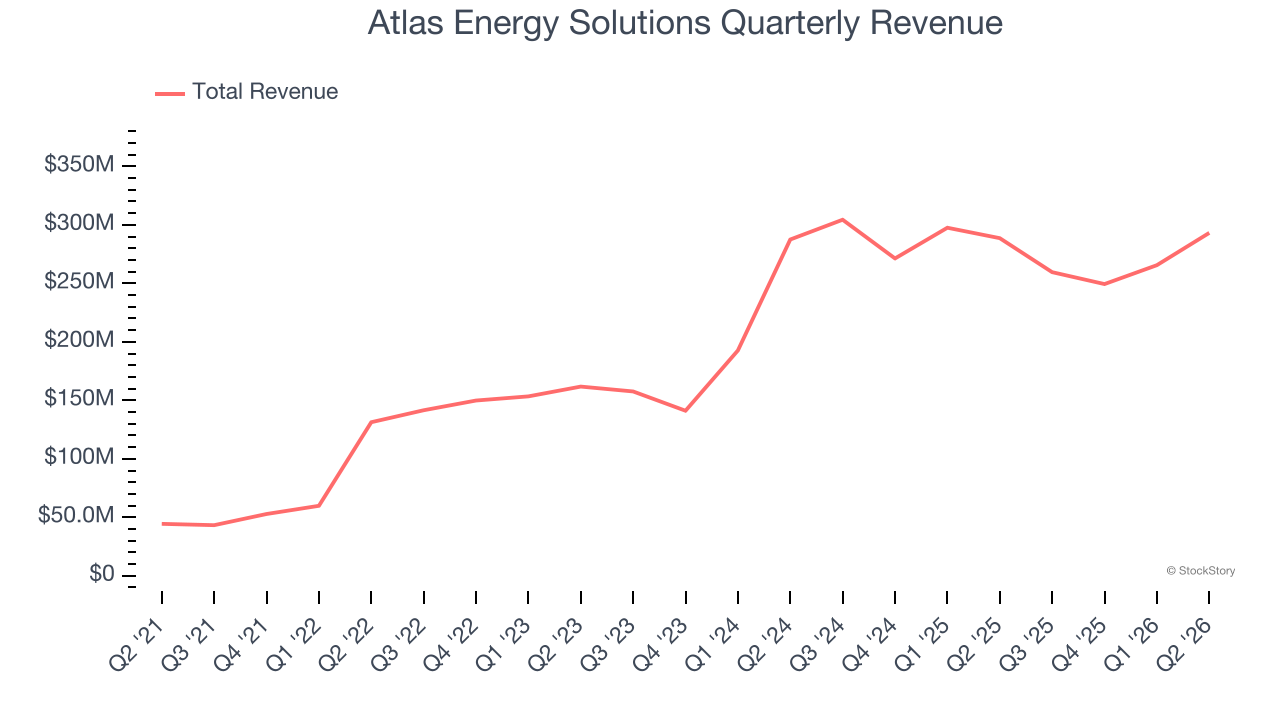
This quarter, Atlas Energy Solutions reported modest year-on-year revenue growth of 1.6% but beat Wall Street’s estimates by 3.1%.
ONE MORE THING: The $21 AI Application Stock Wall Street Forgot. While Wall Street obsesses over who’s building AI, one company is already using it to print money. And nobody’s paying attention.
AI chip stocks trade at ridiculous valuations. This company processes a trillion consumer signals monthly using AI and trades at a third of the price. The gap won’t last. The institutions will figure it out. You need to see this first. Read the FREE Report Before They Notice.
Adjusted EBITDA Margin
Atlas Energy Solutions was profitable over the last five years but held back by its large cost base. Its average EBITDA margin of 31.3% was weak for an upstream and integrated energy business.
Analyzing the trend in its profitability, Atlas Energy Solutions’s EBITDA margin decreased by 38.5 percentage points over the last year. Atlas Energy Solutions’s performance was poor no matter how you look at it - it shows that costs were rising and it couldn’t pass them onto its customers.
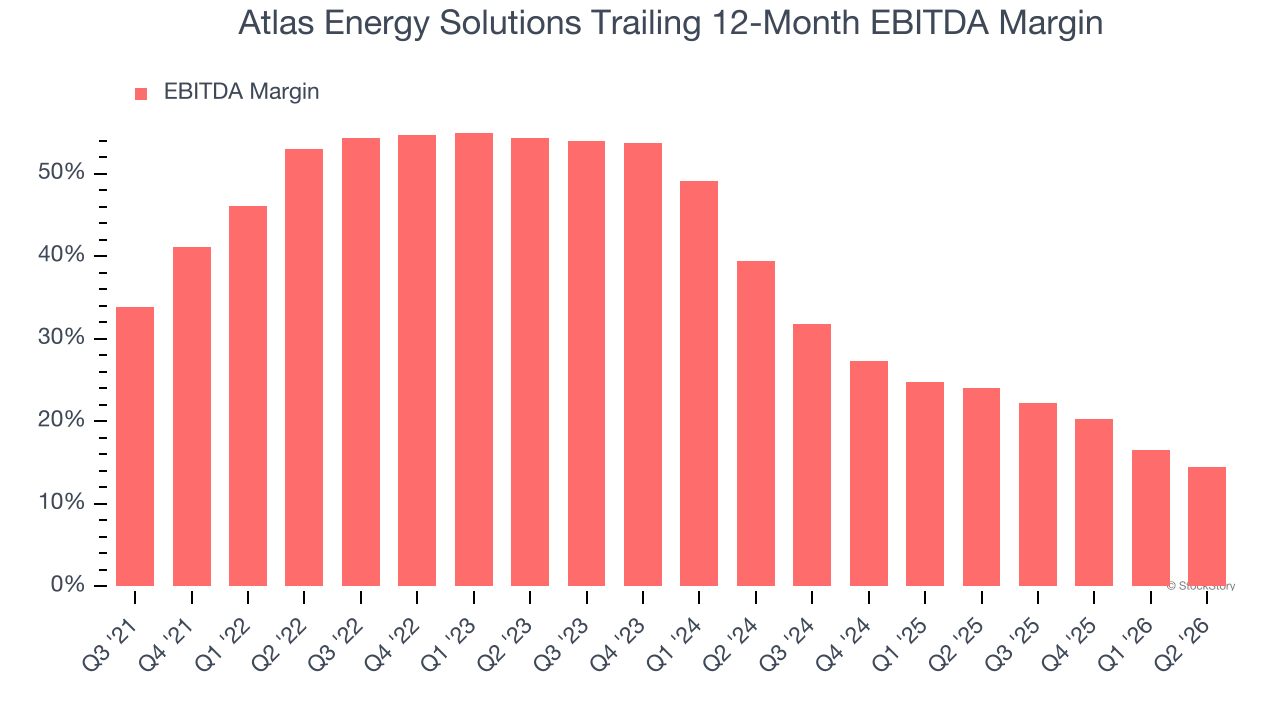
In Q2, Atlas Energy Solutions generated an EBITDA margin profit margin of 16.9%, down 7.5 percentage points year on year. This contraction shows it was less efficient because its expenses grew faster than its revenue. This adjusted EBITDA beat Wall Street’s estimates by 1.3%.
Cash Is King
Adjusted EBITDA shows how profitable a company’s existing “rock” is before financing and reinvestment, while free cash flow shows how much value remains after paying to replace those wells. Because production declines over time, strong EBITDA can coexist with weak FCF if drilling is expensive or declines are steep. FCF therefore captures both operating efficiency and the cost of sustaining production.
While Atlas Energy Solutions posted positive free cash flow this quarter, the broader story hasn’t been so clean. Atlas Energy Solutions’s demanding reinvestments have consumed many resources over the last five years, contributing to an average free cash flow margin of negative 1.7%. This means it lit $1.66 of cash on fire for every $100 in revenue.
While the level of free cash flow margins is important, their consistency matters just as much.
Atlas Energy Solutions’s ratio of quarterly free cash flow volatility to WTI crude price volatility over the past five years was 68.7 (lower is better), indicating that its cash generation is far more sensitive to commodity-price swings than most peers. This elevated volatility limits its access to capital in downturns and makes it unlikely to act as a consolidator when weaker competitors come under pressure.
You may be asking why we wait until the free cash flow line to perform this stability analysis versus commodity prices. Why not compare revenue or EBITDA to WTI Crude prices in the case of Atlas Energy Solutions? Because what ultimately matters is not how much revenue or profit you earn when prices are high but how much cash you can generate when prices are low. Free cash flow is the superior metric because it includes everything from hedging prowess to growth and maintenance capex to management behavior during good times and bad.
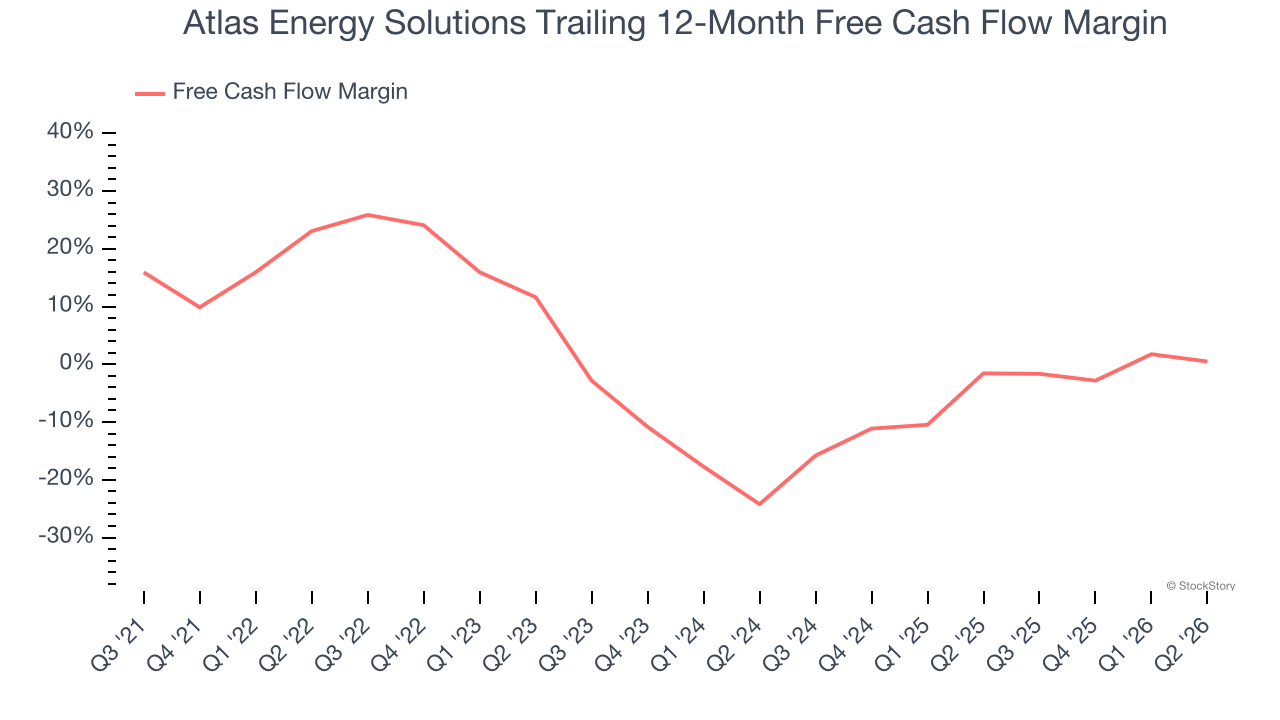
Atlas Energy Solutions’s free cash flow clocked in at $34.89 million in Q2, equivalent to a 11.9% margin. The company’s cash profitability regressed as it was 4.9 percentage points lower than in the same quarter last year, but it’s still above its five-year average. We wouldn’t read too much into this quarter’s decline because investment needs can be seasonal, causing short-term swings. Long-term trends carry greater meaning.
Key Takeaways from Atlas Energy Solutions’s Q2 Results
We enjoyed seeing Atlas Energy Solutions beat analysts’ revenue expectations this quarter. On the other hand, its EPS missed. Overall, this was a weaker quarter. The stock traded down 5.3% to $10.37 immediately following the results.
Is Atlas Energy Solutions an attractive investment opportunity at the current price? The latest quarter does matter, but not nearly as much as longer-term fundamentals and valuation, when deciding if the stock is a buy. We cover that in our actionable full research report which you can read here (it’s free).