Freight Delivery Company ArcBest (NASDAQ: ARCB) met Wall Street’s revenue expectations in Q2 CY2026, with sales up 15.9% year on year to $1.18 billion. Its non-GAAP profit of $2.38 per share was 5.2% above analysts’ consensus estimates.
Is now the time to buy ArcBest? Find out by accessing our full research report, it’s free.
ArcBest (ARCB) Q2 CY2026 Highlights:
- Revenue: $1.18 billion vs analyst estimates of $1.18 billion (15.9% year-on-year growth, in line)
- Adjusted EPS: $2.38 vs analyst estimates of $2.26 (5.2% beat)
- Adjusted EBITDA: $115 million vs analyst estimates of $111.7 million (9.7% margin, 2.9% beat)
- Operating Margin: -1.7%, down from 3.6% in the same quarter last year
- Free Cash Flow Margin: 9.3%, up from 7.9% in the same quarter last year
- Sales Volumes fell 2.8% year on year (5.6% in the same quarter last year)
- Market Capitalization: $3.33 billion
“Our second-quarter performance reflects disciplined execution, a more constructive operating environment and the value customers are gaining from our integrated logistics solutions,” said Seth Runser, ArcBest President and CEO.
Company Overview
Historically owning furniture, banking, and other subsidiaries, ArcBest (NASDAQ: ARCB) offers full-truckload, less-than-truckload, and intermodal deliveries of freight.
Revenue Growth
A company’s long-term performance is an indicator of its overall quality. Any business can put up a good quarter or two, but the best consistently grow over the long haul. Regrettably, ArcBest’s sales grew at a sluggish 4.4% compounded annual growth rate over the last five years. This was below our standard for the industrials sector and is a rough starting point for our analysis.
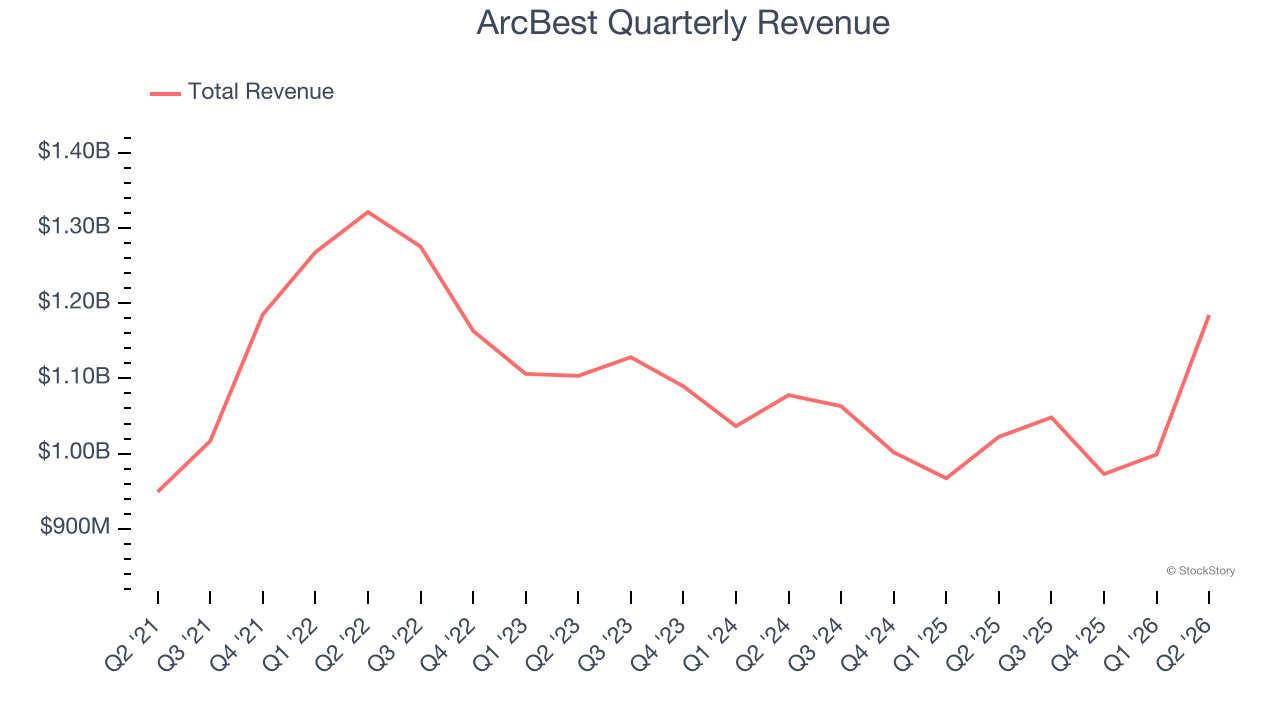
Long-term growth is the most important, but within industrials, a half-decade historical view may miss new industry trends or demand cycles. ArcBest’s performance shows it grew in the past but relinquished its gains over the last two years, as its revenue fell by 1.5% annually. 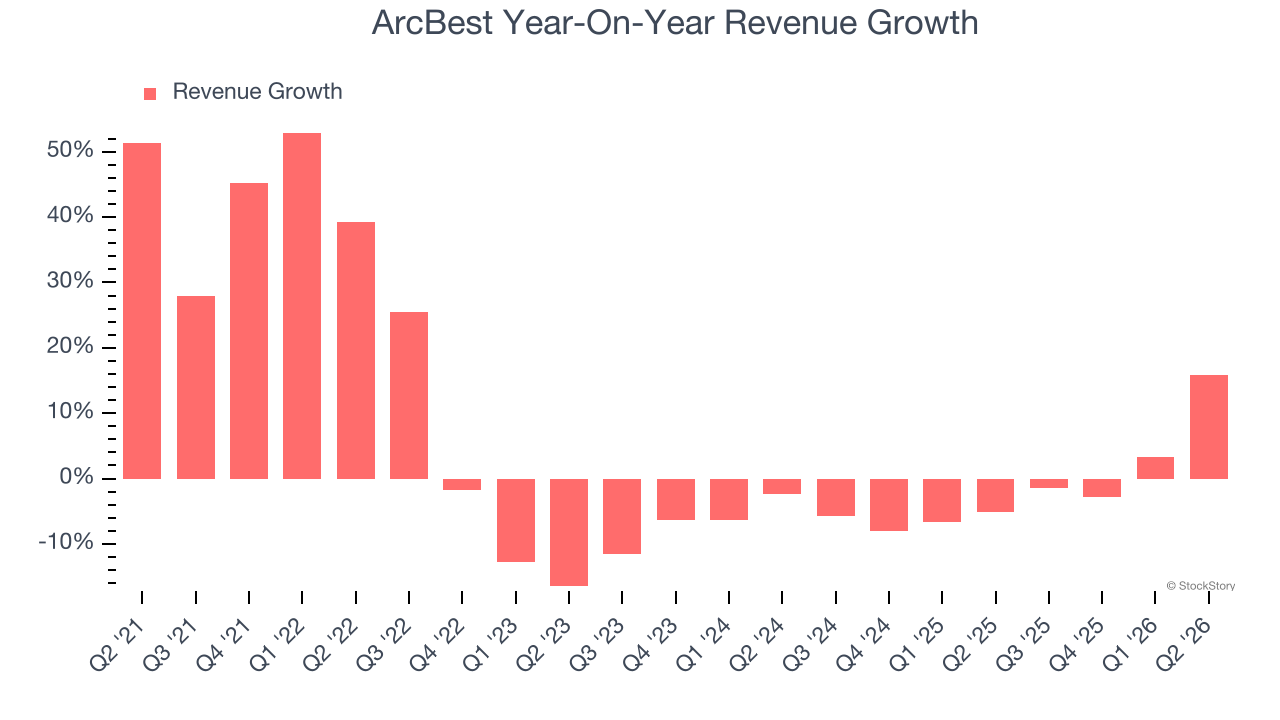
We can better understand the company’s revenue dynamics by analyzing its number of units sold, which reached 20,456 in the latest quarter. Over the last two years, ArcBest’s units sold averaged 1.8% year-on-year growth. Because this number is better than its revenue growth, we can see the company’s average selling price decreased. 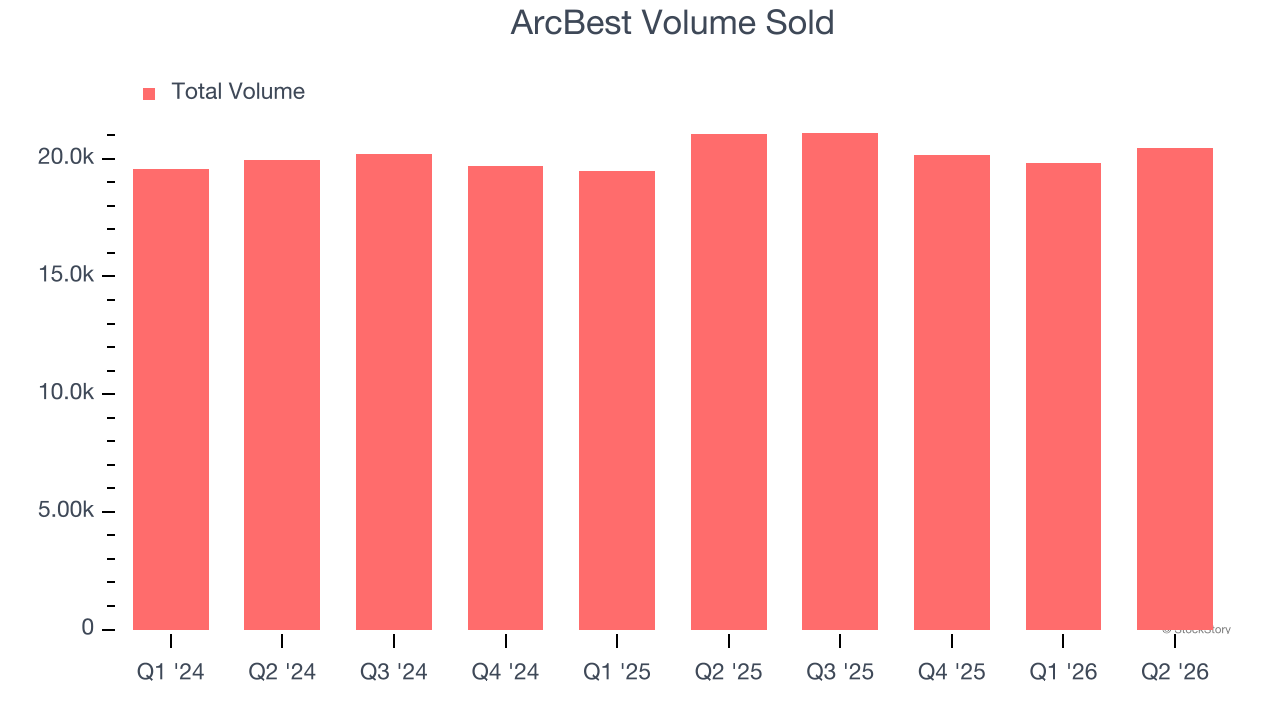
This quarter, ArcBest’s year-on-year revenue growth was 15.9%, and its $1.18 billion of revenue was in line with Wall Street’s estimates.
Looking ahead, sell-side analysts expect revenue to grow 10.4% over the next 12 months, an improvement versus the last two years. This projection is commendable and implies its newer products and services will catalyze better top-line performance.
ONE MORE THING: The $21 AI Application Stock Wall Street Forgot. While Wall Street obsesses over who’s building AI, one company is already using it to print money. And nobody’s paying attention.
AI chip stocks trade at ridiculous valuations. This company processes a trillion consumer signals monthly using AI and trades at a third of the price. The gap won’t last. The institutions will figure it out. You need to see this first. Read the FREE Report Before They Notice.
Operating Margin
Operating margin is a key measure of profitability. Think of it as net income - the bottom line - excluding the impact of taxes and interest on debt, which are less connected to business fundamentals.
ArcBest was profitable over the last five years but held back by its large cost base. Its average operating margin of 4.8% was weak for an industrials business. This result isn’t too surprising given its low gross margin as a starting point.
Analyzing the trend in its profitability, ArcBest’s operating margin decreased by 7.7 percentage points over the last five years. This raises questions about the company’s expense base because its revenue growth should have given it leverage on its fixed costs, resulting in better economies of scale and profitability. ArcBest’s performance was poor no matter how you look at it - it shows that costs were rising and it couldn’t pass them onto its customers.
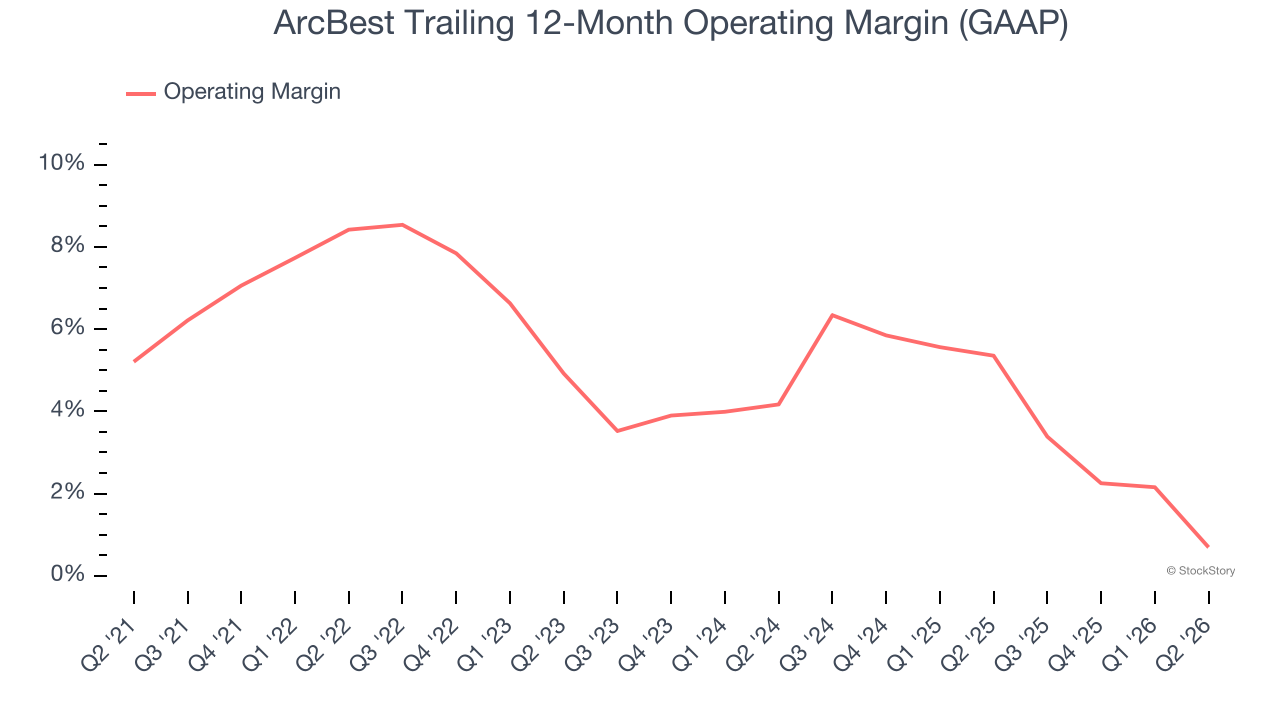
In Q2, ArcBest generated an operating margin profit margin of negative 1.7%, down 5.4 percentage points year on year. The contraction shows it was less efficient because its expenses grew faster than its revenue.
Earnings Per Share
We track the long-term change in earnings per share (EPS) for the same reason as long-term revenue growth. Compared to revenue, however, EPS highlights whether a company’s growth is profitable.
Sadly for ArcBest, its EPS declined by 2.7% annually over the last five years while its revenue grew by 4.4%. This tells us the company became less profitable on a per-share basis as it expanded due to non-fundamental factors such as interest expenses and taxes.
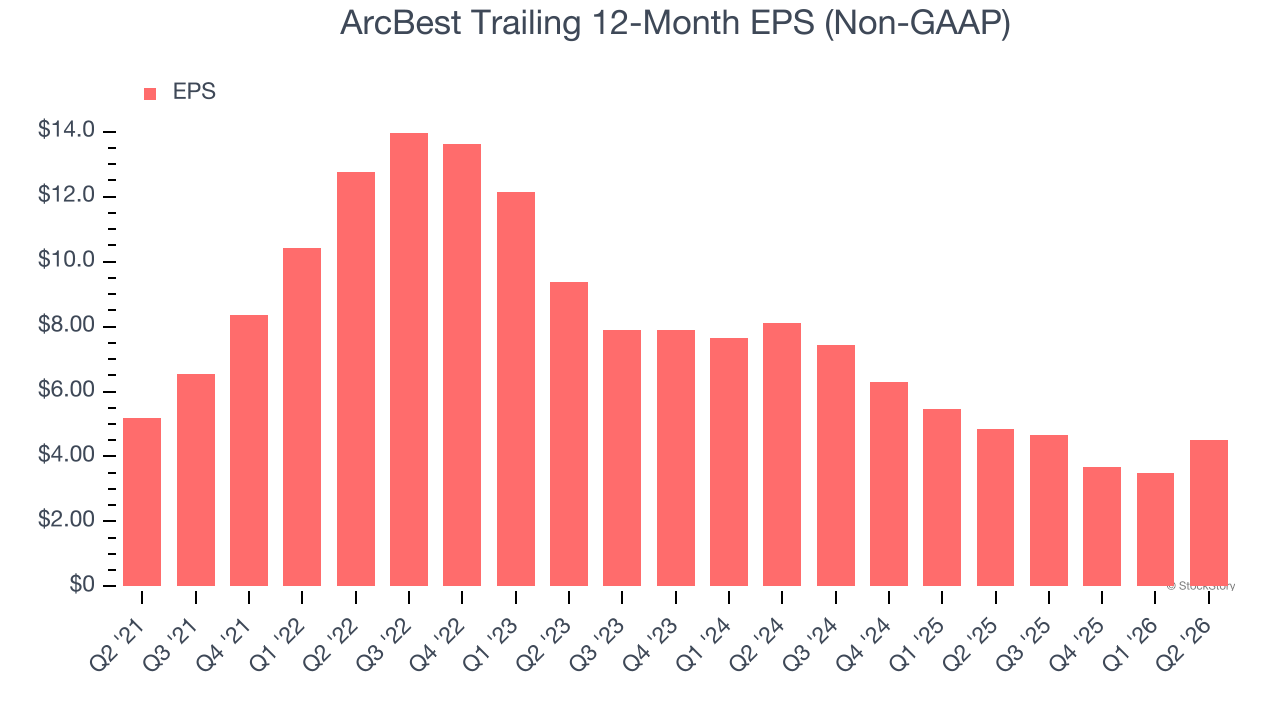
We can take a deeper look into ArcBest’s earnings to better understand the drivers of its performance. As we mentioned earlier, ArcBest’s operating margin declined by 7.7 percentage points over the last five years. This was the most relevant factor (aside from the revenue impact) behind its lower earnings; interest expenses and taxes can also affect EPS but don’t tell us as much about a company’s fundamentals.
Like with revenue, we analyze EPS over a shorter period to see if we are missing a change in the business.
For ArcBest, its two-year annual EPS declines of 25.3% show it’s continued to underperform. These results were bad no matter how you slice the data.
In Q2, ArcBest reported adjusted EPS of $2.38, up from $1.36 in the same quarter last year. This print beat analysts’ estimates by 5.2%. Over the next 12 months, Wall Street expects ArcBest’s full-year EPS to grow 71.8% from $4.52 to $7.76.
Key Takeaways from ArcBest’s Q2 Results
It was encouraging to see ArcBest beat analysts’ EBITDA expectations this quarter. We were also glad its EPS outperformed Wall Street’s estimates. Overall, this print had some key positives. The stock remained flat at $148.86 immediately following the results.
Is ArcBest an attractive investment opportunity at the current price? If you’re making that decision, you should consider the bigger picture of valuation, business qualities, as well as the latest earnings. We cover that in our actionable full research report which you can read here (it’s free).