Gaming company Inspired (NASDAQ: INSE) missed Wall Street’s revenue expectations in Q3 2026, with revenue falling 28.8% year on year to $61.4 million. Its non-GAAP profit of $0.10 per share was significantly above analysts’ consensus estimates.
For more on Inspired, read the full research report, available free.
Inspired (INSE) Q3 2026 highlights:
- Revenue $61.4 million vs S&P analysts’ consensus estimates of $65.32 million (28.8% year-on-year decline, 6% miss)
- Adjusted EPS $0.10 vs S&P analysts’ consensus estimates of $0.01 (significant beat)
- Adjusted EBITDA $28.2 million vs analysts’ consensus estimates of $28.73 million (45.9% margin, 1.8% miss)
- Operating margin 16.8%, up from 11.3% in the same quarter last year
- Free cash flow margin 22.1%, up from 1.6% in the same quarter last year
- Market capitalization $99.11 million
“Our third-quarter results highlight our progress in building a higher-margin, more digital business, with record Adjusted EBITDA margins and market share gains in Interactive,” said Brooks Pierce, President and Chief Executive Officer of Inspired. “Retail Solutions delivered another strong performance in the UK and Greece, with further opportunities to refresh our installed base in Greece next year. In Interactive, revenue grew 3% year over year as UK volume growth offset the higher gaming tax and our U.S. business outpaced the U.S. iGaming market.
Revenue growth
A company’s long-term performance is an indicator of its overall quality. Any business can have short-term success, but a top-tier one grows for years. Inspired’s revenue grew at a weak 3.7% compounded annual growth rate over the last five years, falling short of the consumer discretionary sector standard.
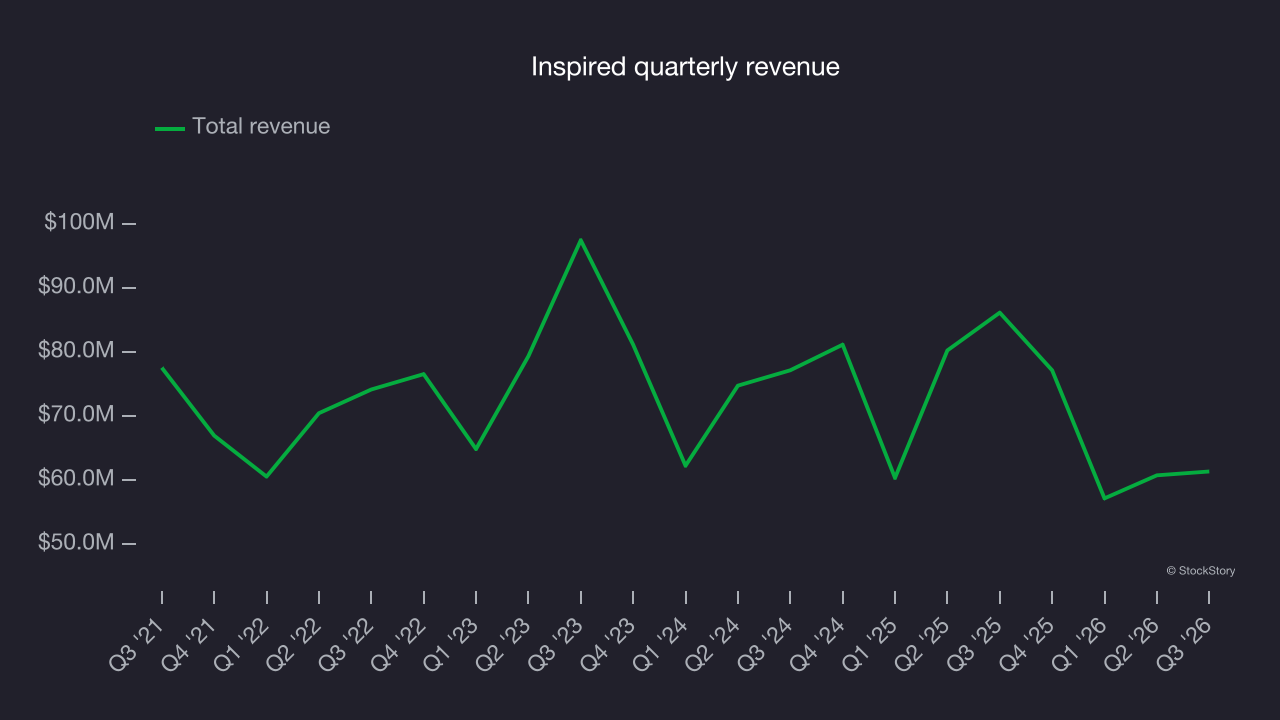
Long-term growth is the most important, but within consumer discretionary, product cycles are short and revenue can be hit-driven due to rapidly changing trends and consumer preferences. Inspired’s performance shows it grew in the past but relinquished its gains over the last two years, as its revenue fell by 6.8% annually. 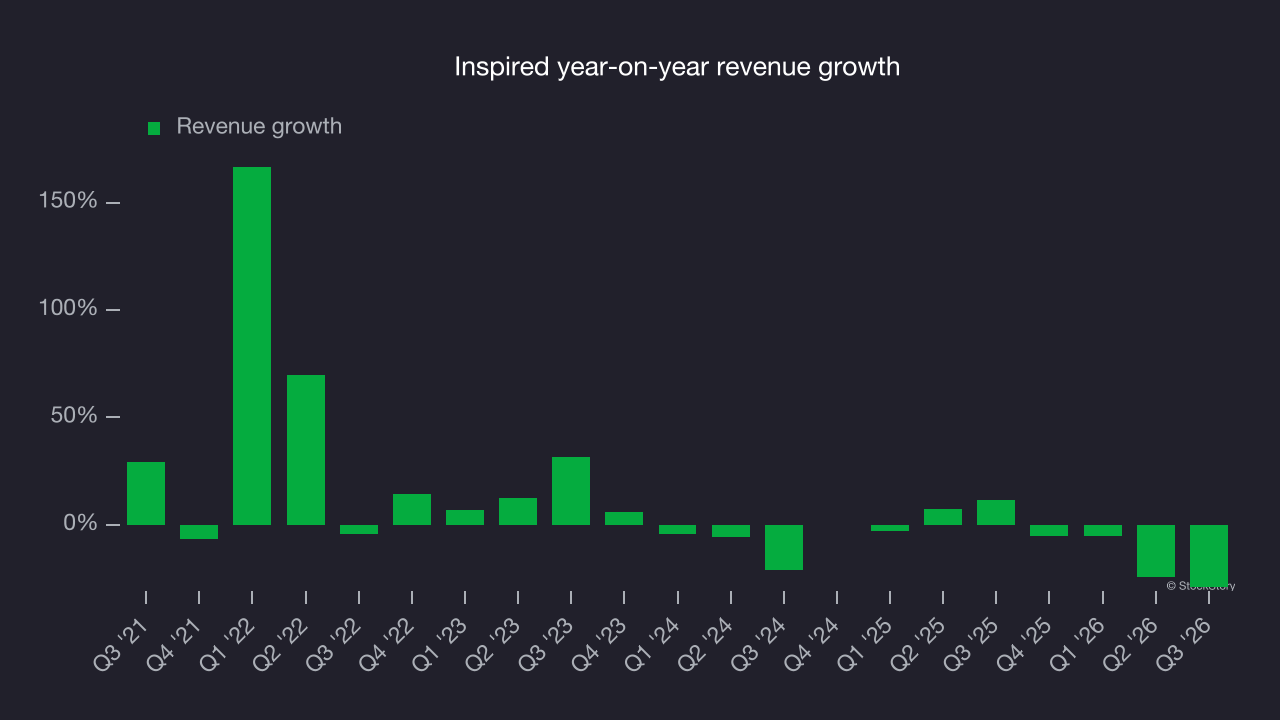
Inspired also breaks out the revenue for its three most important segments: Gaming, Leisure and Virtual Sports, which are 60.9%, 13.8% and 25.2% of revenue. Over the last two years, Inspired’s Gaming (land-based casino games) and Virtual Sports (digital gaming and sports betting) revenues averaged year-on-year growth of 11.4% and 57.5%. On the other hand, its Leisure revenue (gaming terminals and amusement machines) averaged 43.6% declines. 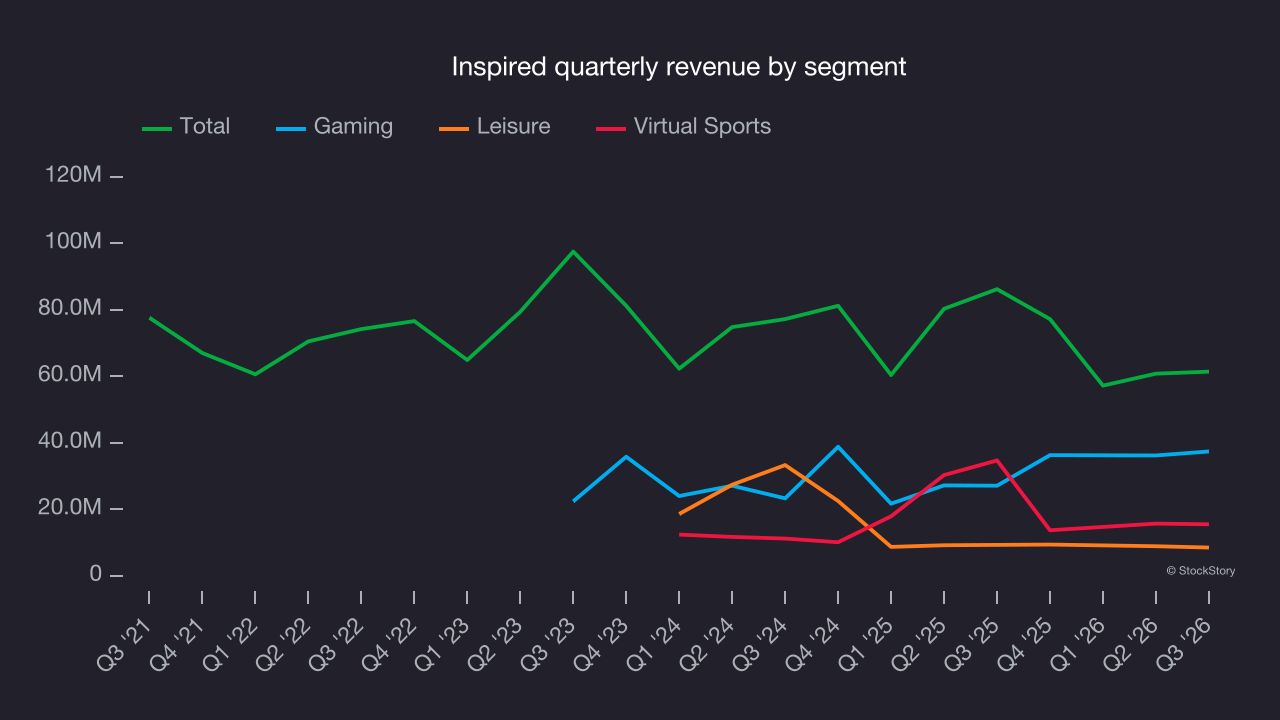
This quarter, Inspired missed Wall Street’s consensus estimates and reported an uninspiring 28.8% year-on-year revenue decline, generating $61.4 million of revenue.
Looking ahead, sell-side analysts expect revenue to grow 1.2% over the next 12 months, according to S&P. Although this projection suggests its newer products and services will fuel better top-line performance, it is still below the sector average.
Operating margin
Operating margin is an important measure of profitability as it shows the portion of revenue left after accounting for all core expenses, everything from the cost of goods sold to advertising and wages. It’s also useful for comparing profitability across companies with different levels of debt and tax rates because it excludes interest and taxes.
Inspired’s operating margin has risen over the last 12 months and averaged 12.9% over the last two years. The company’s improved efficiency is a positive, but its suboptimal cost structure means profitability remains inadequate for a consumer discretionary business.
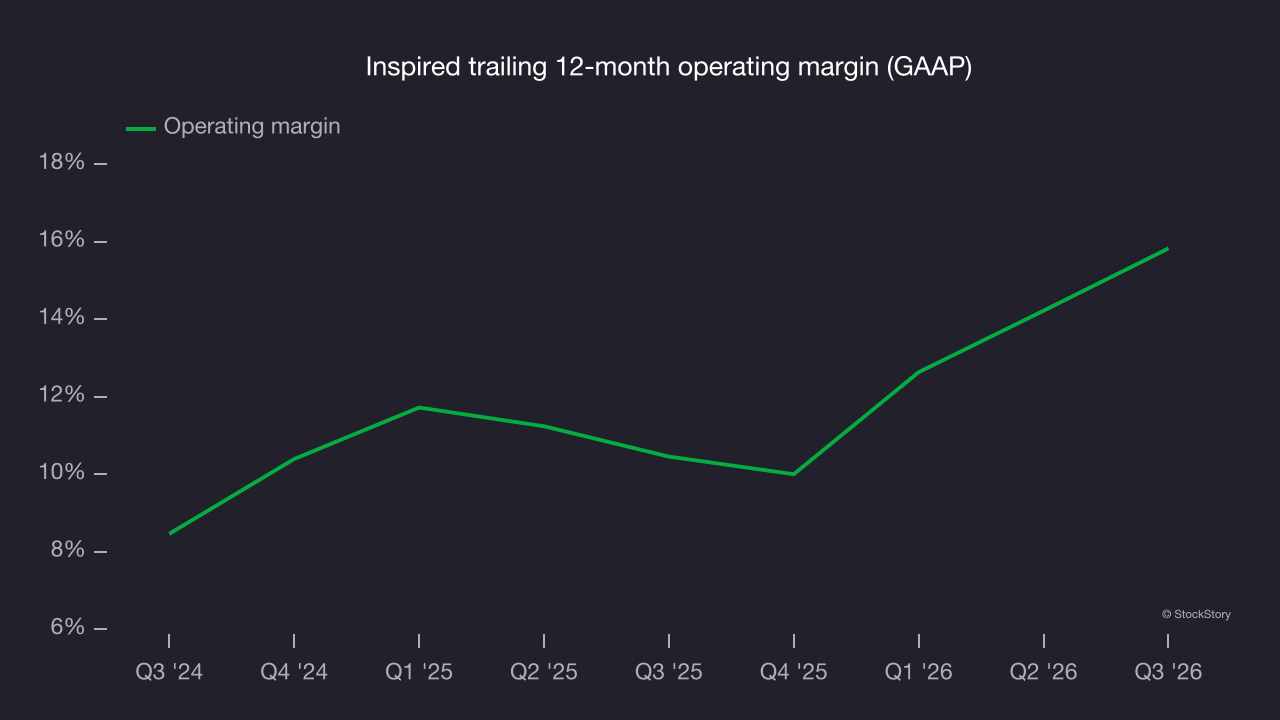
In Q3, Inspired generated an operating margin of 16.8%, up 5.5 percentage points year on year. This increase was a positive development, especially since its revenue fell, showing it became more efficient by reducing expenses.
Earnings per share
Long-term changes in earnings per share, or EPS, matter for the same reason as long-term revenue growth. Compared to revenue, however, EPS highlights whether a company’s growth is profitable.
Inspired’s full-year EPS turned negative over the last three years. Companies with falling revenue and EPS warrant caution, as diminishing earnings could imply changing secular trends and preferences. Consumer discretionary companies are particularly exposed to this, and if those trends shift unexpectedly, Inspired’s low margin of safety could leave its stock price susceptible to large declines.
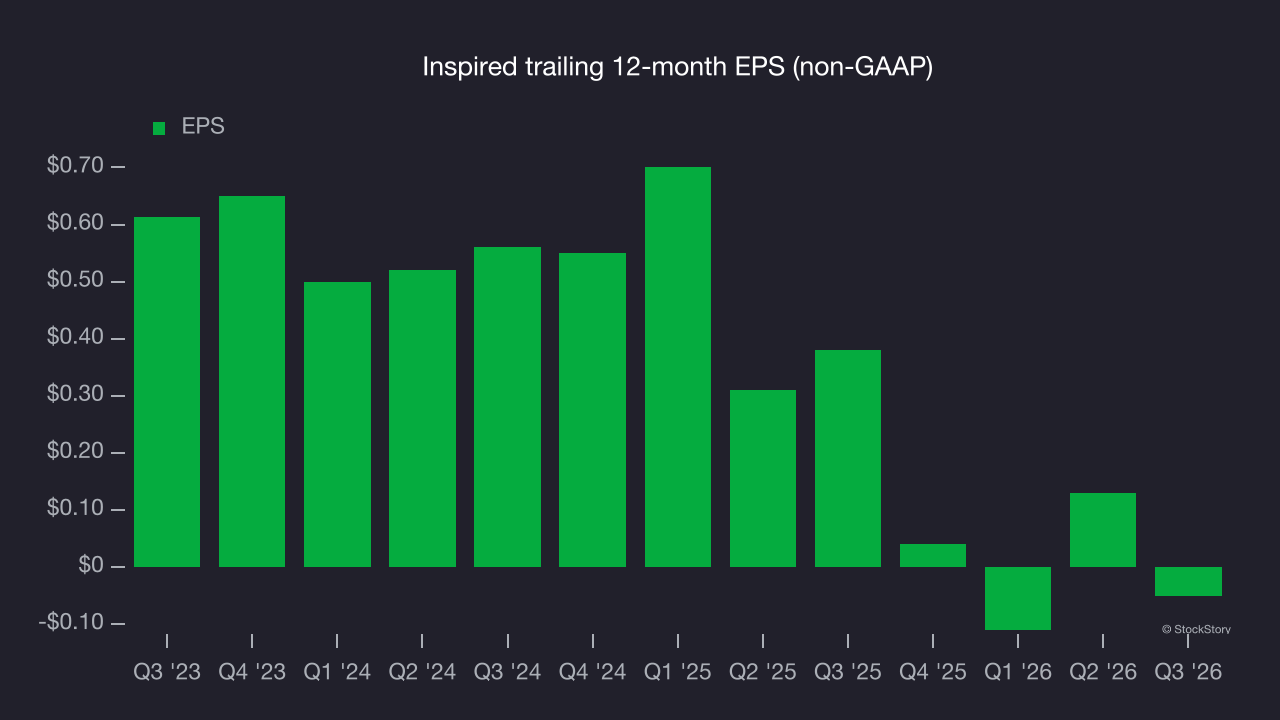
In Q3, Inspired reported adjusted EPS of $0.10, down from $0.28 in the same quarter last year. Despite falling year on year, EPS came in well above analysts’ consensus estimates. Over the next 12 months, Wall Street expects earnings to recover. Analysts forecast Inspired’s full-year EPS will turn positive, rising from negative $0.05 to positive $0.02, according to S&P.
Key takeaways from Inspired’s Q3 results
Inspired’s EPS beat analysts’ consensus estimates, but revenue fell short, making this a softer quarter overall. Shares fell 4.2% to $3.35 immediately after the report.
Is Inspired worth considering as an investment? What happened in the latest quarter matters, but not as much as longer-term business quality and valuation when deciding whether to invest in this stock. Read the full research report here (it’s free).