Solar tracking systems manufacturer Array (NASDAQ: ARRY) reported Q3 2026 results exceeding the market’s revenue expectations, but revenue fell by 16.1% year on year to $330.2 million. On the other hand, next quarter’s revenue guidance of $475 million was less impressive, coming in 13.4% below analysts’ consensus estimates. Its non-GAAP profit of $0.06 per share was 34.7% below analysts’ consensus estimates.
For more on Array, read our full research report for free.
Array (ARRY) Q3 2026 highlights:
- Revenue $330.2 million vs S&P analysts’ consensus estimates of $322.3 million (16.1% year-on-year decline, 2.5% beat)
- Adjusted EPS $0.06 vs S&P analysts’ consensus estimates of $0.09 (34.7% miss)
- Adjusted EBITDA $32.06 million vs analysts’ consensus estimates of $37.86 million (9.7% margin, 15.3% miss)
- Revenue guidance $475 million at the midpoint for Q4 2026, below analysts’ consensus estimates of $548.8 million
- Adjusted EPS guidance Management lowered its full-year adjusted EPS guidance to $0.63 at the midpoint, an 11.9% decrease
- EBITDA guidance $200 million at the midpoint for the full year, below analysts’ consensus estimates of $221.2 million
- Operating margin 4.2%, down from 11.6% in the same quarter last year
- Free cash flow -$1.08 million, down from $21.85 million in the same quarter last year
- Market capitalization $714.6 million
“The third quarter marked another significant milestone in ARRAY’s evolution from a tracker company to a provider of integrated energy infrastructure solutions. With the completion of our Affordable Wire Management acquisition, we advanced our balance-of-system strategy and gained access to the fast-growing battery energy storage and data center markets. Combined with the formal launch of ARRAY Atlas™ I and II and our new 60-degree U.S. tracker variant, we are delivering on our strategy to offer customers a more complete, interoperable solution set. This is translating into strong commercial momentum, with a record orderbook of $2.6 billion, up 42% year-over-year, and a trailing twelve-month book-to-bill of 1.6x,” said Chief Executive Officer Kevin G. Hostetler.
Revenue growth
A company’s long-term revenue performance can indicate its overall quality. Any business can have short-term success, but a top-tier one grows for years. Array’s revenue grew at a mediocre 6.6% compounded annual growth rate over the last five years, falling short of the industrials sector benchmark.
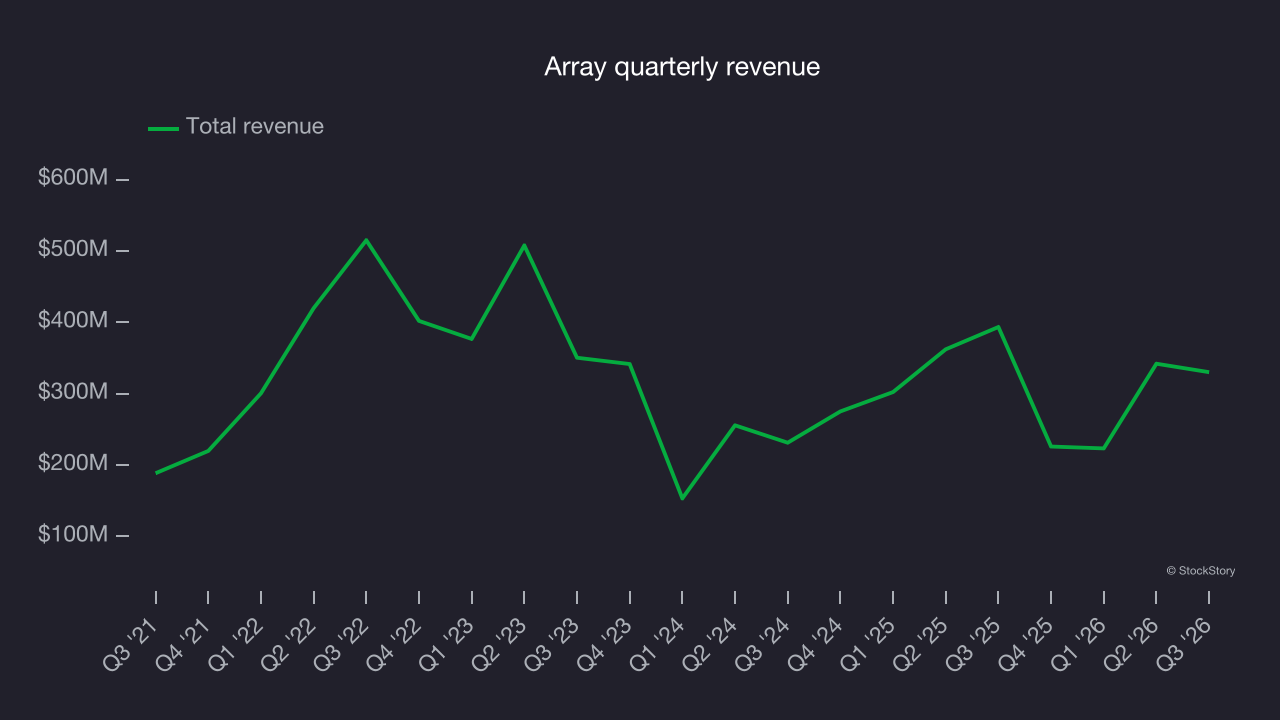
Long-term growth is the most important, but within industrials, a half-decade historical view may miss new industry trends or demand cycles. Array’s annualized revenue growth of 6.9% over the last two years aligns with its five-year trend, suggesting its demand was consistently weak. 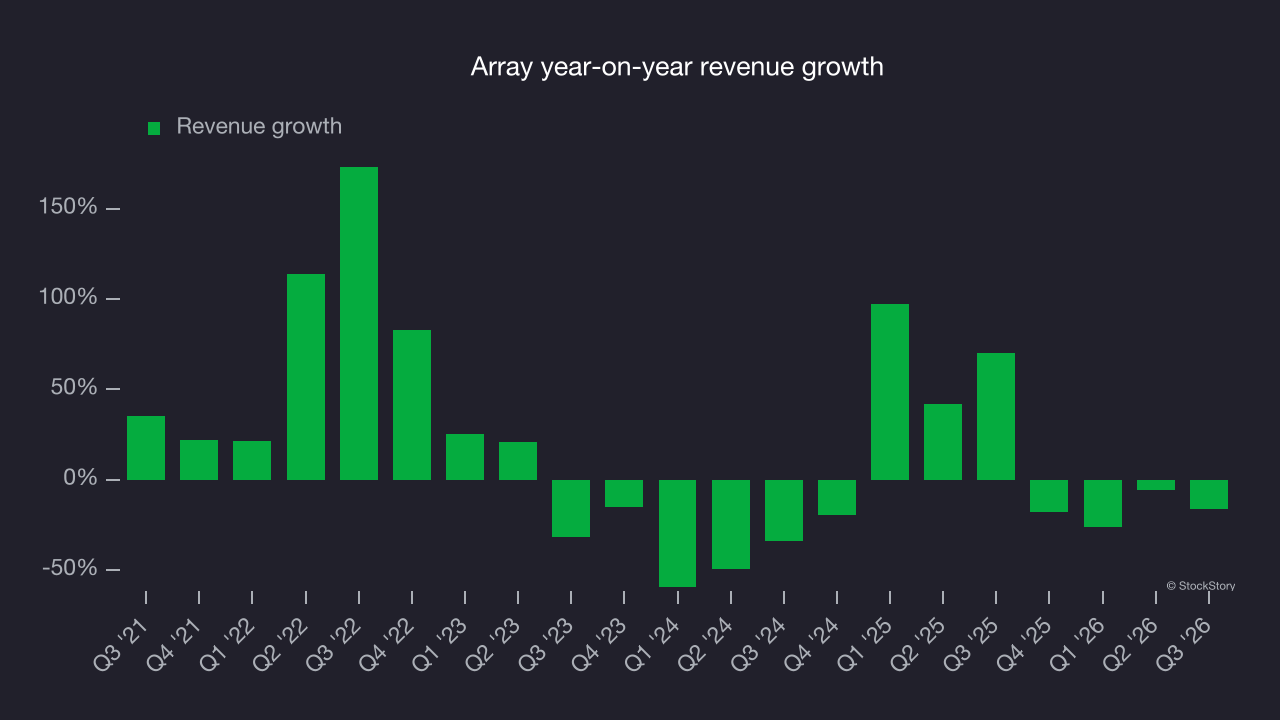
This quarter, Array’s revenue fell by 16.1% year on year to $330.2 million but beat Wall Street’s consensus estimates by 2.5%. Management is guiding for a 110% year-on-year increase in revenue next quarter.
Looking further ahead, sell-side analysts expect revenue to grow 32% over the next 12 months, according to S&P, an improvement versus the last two years. That strong growth projection suggests its newer products and services will spur better top-line performance.
Operating margin
Operating margin is one of the best measures of profitability because it shows how much money a company retains after procuring and manufacturing its products, marketing and selling those products and, most importantly, keeping them relevant through research and development.
Array roughly broke even based on its average quarterly operating profit over the last five years, one of the worst outcomes in the industrials sector. That outcome is unsurprising given its low gross margin baseline.
Looking at the trend in its profitability, Array’s operating margin decreased by 5.4 percentage points over the last five years. This raises questions about the company’s expense base because its revenue growth should have given it leverage on its fixed costs, resulting in better economies of scale and profitability. Array’s poor performance shows that costs were rising and it couldn’t pass them on to its customers.
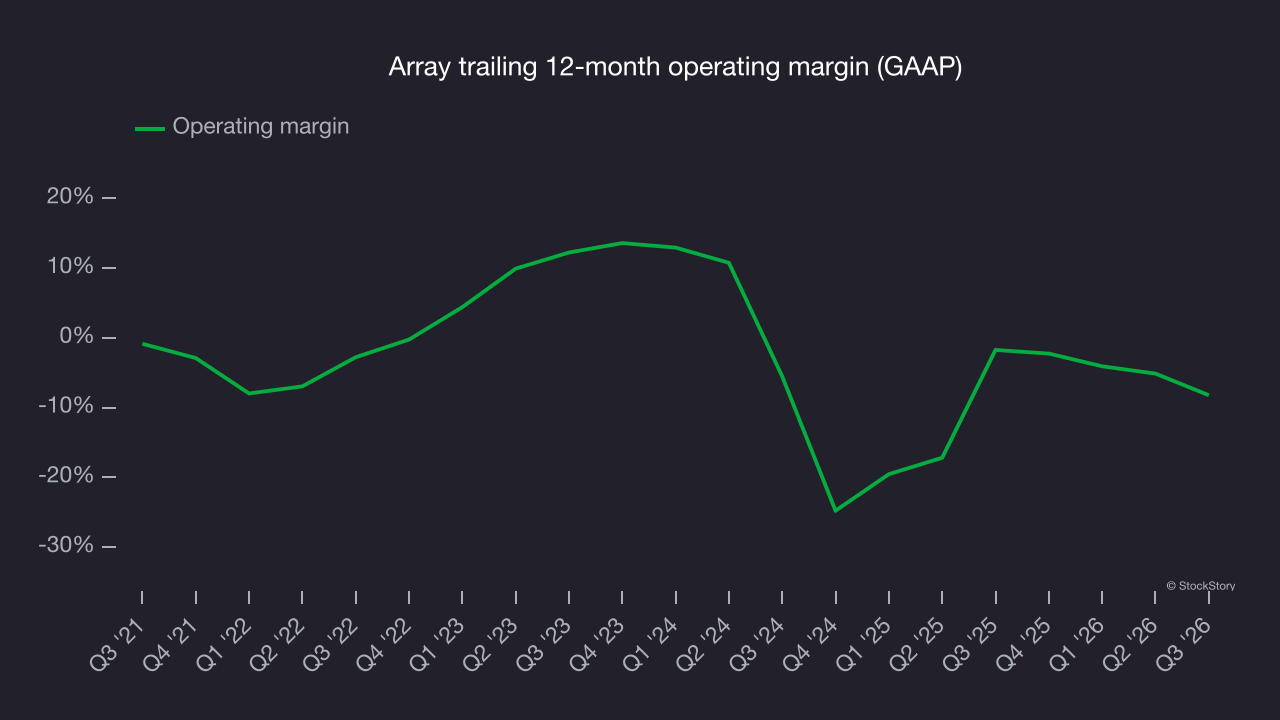
This quarter, Array generated an operating margin of 4.2%, down 7.3 percentage points year on year. Array’s operating margin decreased more than its gross margin, suggesting it was less efficient because expenses such as marketing, research and development and administrative overhead increased.
Earnings per share
Long-term changes in earnings per share, or EPS, matter for the same reason as long-term revenue growth. Compared to revenue, however, EPS highlights whether a company’s growth is profitable.
Array’s unimpressive 5.3% annual EPS growth over the last five years aligns with its revenue performance. On the positive side, this indicates its incremental revenue was profitable.
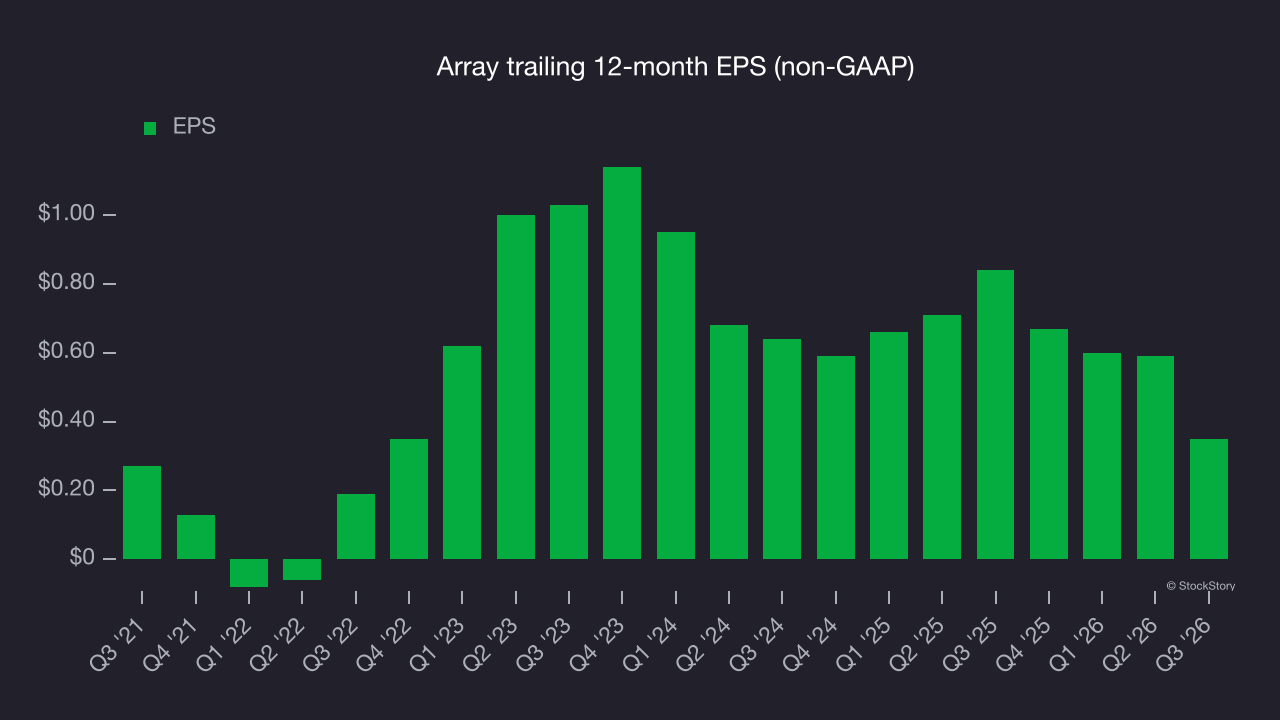
As with revenue, we analyze EPS over a more recent period because it can provide insight into an emerging theme or development for the business.
Array’s EPS declined at an annual rate of 26% over the last two years, a poor result that trailed its 6.9% two-year revenue growth.
Diving into the nuances of Array’s earnings can give us a better understanding of its performance. A two-year view shows Array has diluted its shareholders, growing its share count by 1.4%. This dilution overshadowed its increased operational efficiency and has led to lower per share earnings. 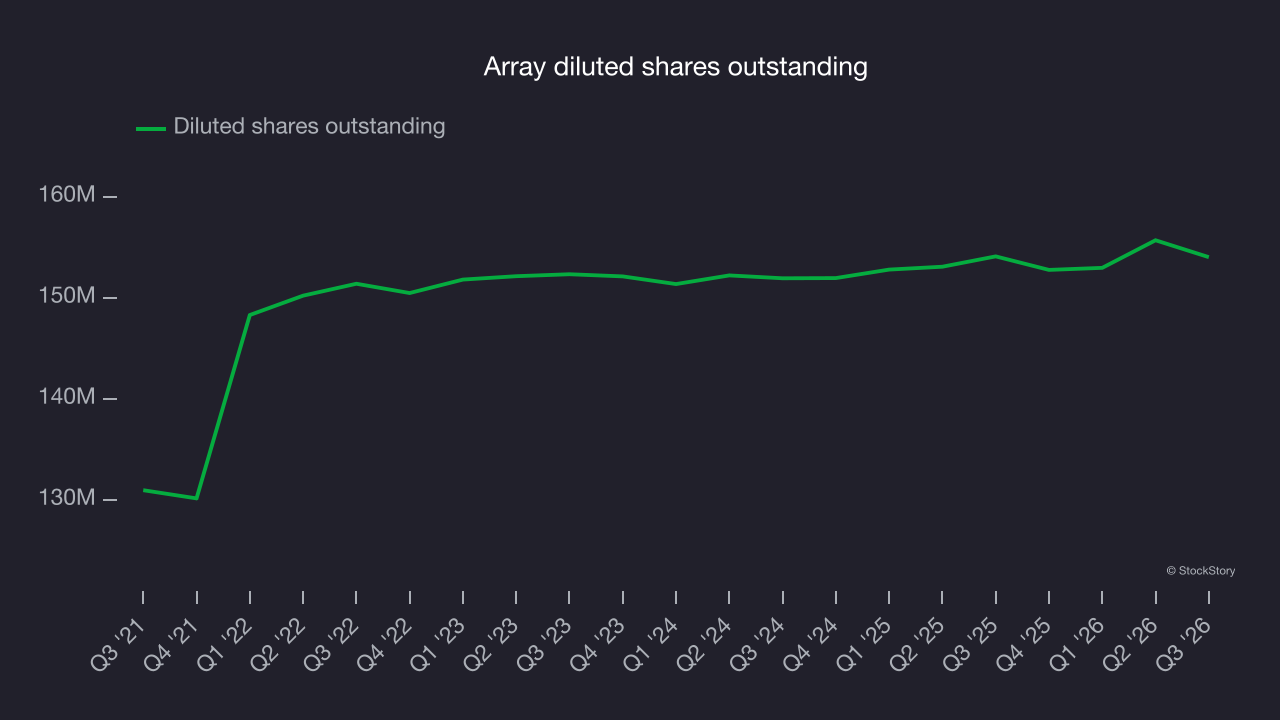
In Q3, Array reported adjusted EPS of $0.06, down from $0.30 in the same quarter last year. This result missed analysts’ consensus estimates. Over the next 12 months, Wall Street expects Array’s full-year EPS to grow 170% from $0.35 to $0.94, according to S&P.
Key takeaways from Array’s Q3 results
Array’s revenue beat analysts’ consensus estimates in Q3, but the full-year outlook fell short: Both revenue and EBITDA guidance missed Wall Street’s consensus. That left the quarter short of a stronger showing. Shares remained flat at $5.36 immediately after the release.
To assess Array as an investment at the current price, consider its valuation, business quality and latest quarterly results. For more on Array, read the full research report here (it’s free).