Dental and medical products company Henry Schein (NASDAQ: HSIC) met Wall Street’s revenue expectations in Q3 2026, with revenue up 4% year on year to $3.47 billion. Its non-GAAP profit of $1.56 per share was 14.9% above analysts’ consensus estimates.
For more on Henry Schein, read our free full research report.
Henry Schein (HSIC) Q3 2026 highlights:
- Revenue $3.47 billion vs S&P analysts’ consensus estimates of $3.48 billion (4% year-on-year growth, in line)
- Adjusted EPS $1.56 vs S&P analysts’ consensus estimates of $1.36 (14.9% beat)
- Adjusted EBITDA $321 million vs analysts’ consensus estimates of $295.7 million (9.2% margin, 8.6% beat)
- Adjusted EPS guidance Management raised its full-year adjusted EPS guidance to $5.53 at the midpoint, a 3.6% increase
- Operating margin 5.6%, in line with the same quarter last year
- Free cash flow margin 3.3%, similar to the same quarter last year
- Organic revenue rose 3.1% year on year (miss)
- Market capitalization $9.65 billion
“We delivered another strong quarter that increases our confidence in the momentum we are building at Henry Schein. I am very pleased with the U.S. dental merchandise sales growth of 8.6% driven primarily by volume in a stable market and our 19% adjusted earnings per share growth4,” said Fred Lowery, chief executive officer of Henry Schein. “Our strategy is translating into stronger financial results. We are gaining share in key businesses, improving our portfolio mix, maintaining a disciplined approach to capital allocation, and realizing the benefits of our value creation initiatives,” Lowery added.
Revenue growth
A company’s long-term revenue performance can indicate its overall quality. Even a weak business can perform well for one or two quarters, but a high-quality one grows for years. Henry Schein’s revenue grew at a tepid 2.3% annualized rate over the last five years, falling short of our benchmarks.
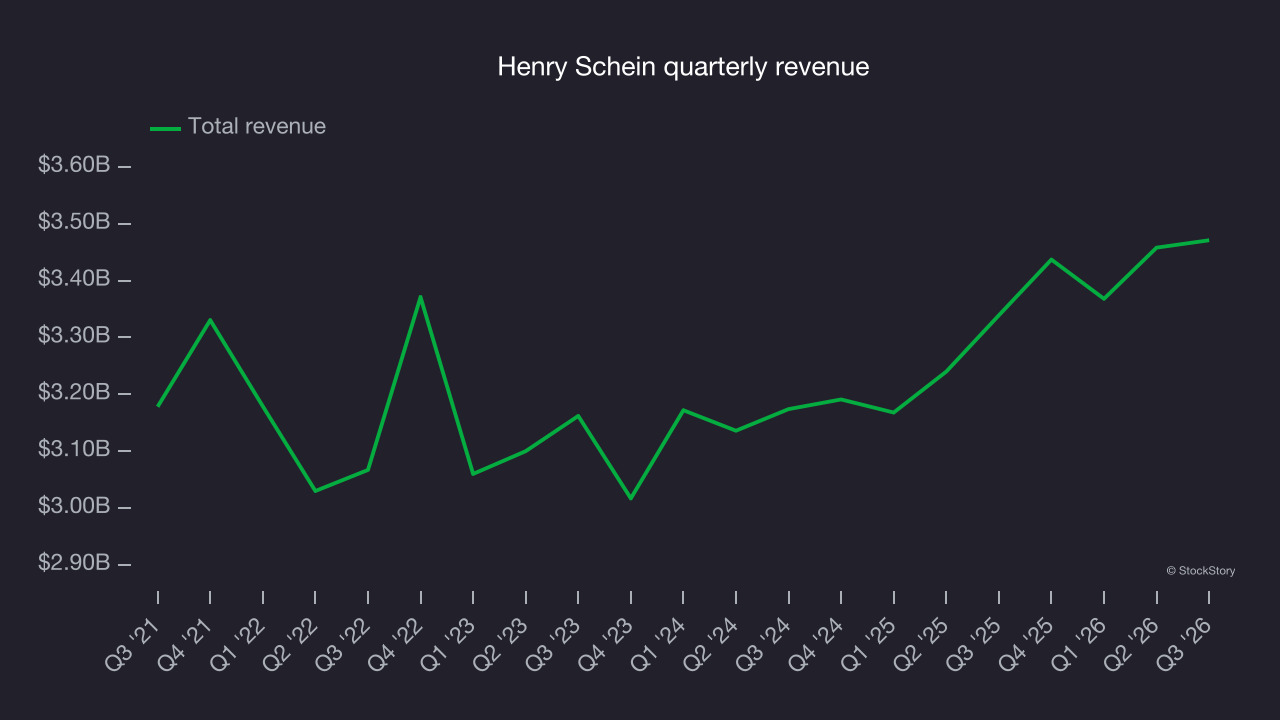
Long-term growth is the most important, but within healthcare, a half-decade historical view may miss new innovations or demand cycles. Henry Schein’s annualized revenue growth of 4.8% over the last two years is above its five-year trend, a positive sign. 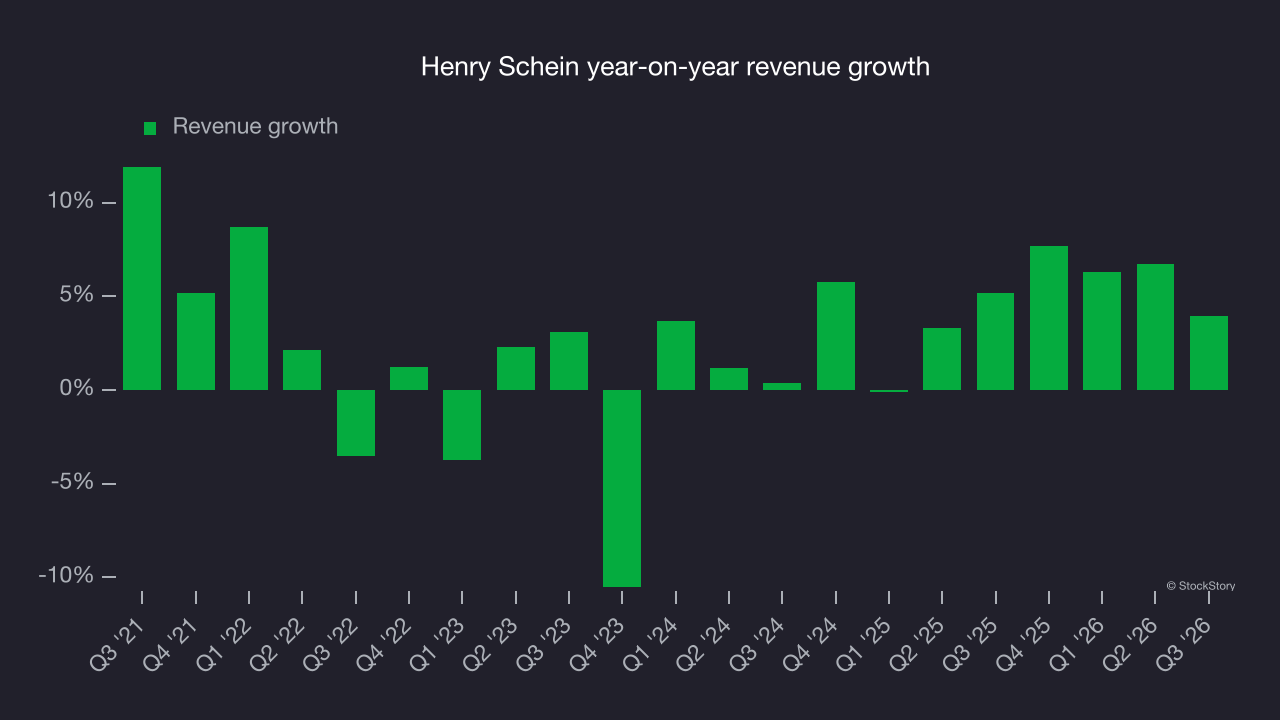
Henry Schein also reports organic revenue, which strips out one-time events like acquisitions and currency fluctuations that don’t accurately reflect its fundamentals. Over the last two years, Henry Schein’s organic revenue averaged 3.7% year-on-year growth. This was in line with its two-year revenue growth, indicating that core operations, rather than acquisitions and divestitures, drove most of its results. 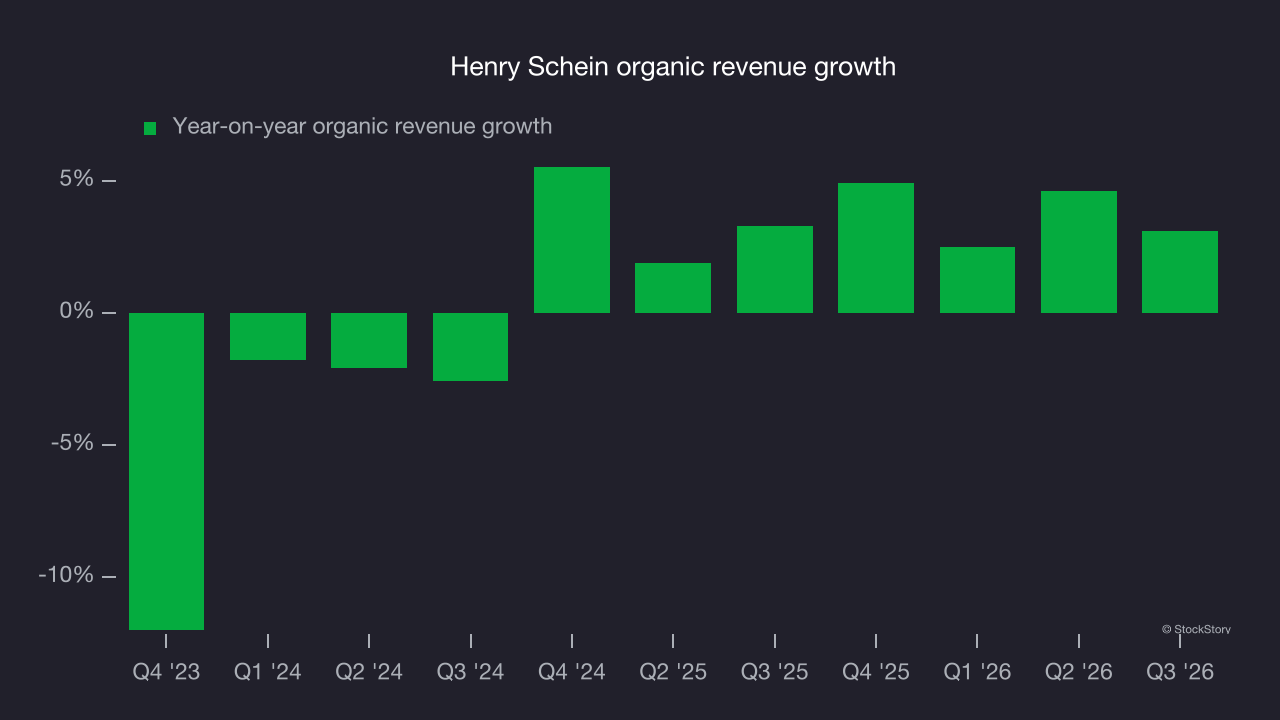
This quarter, Henry Schein grew its revenue by 4% year on year, and its $3.47 billion of revenue was in line with Wall Street’s consensus estimates.
Looking ahead, sell-side analysts expect revenue to grow 3.9% over the next 12 months, according to S&P, similar to its two-year rate. This projection is underwhelming and indicates its newer products and services will not accelerate its top-line performance yet.
Adjusted operating margin
Adjusted operating margin is a key measure of profitability. Think of it as net income (the bottom line) excluding the impact of non-recurring expenses, taxes and interest on debt – metrics less connected to business fundamentals.
Henry Schein was profitable over the last five years but held back by its large cost base. Its average adjusted operating margin of 7.4% was weak for a healthcare business.
Looking at the trend in its profitability, Henry Schein’s adjusted operating margin decreased by 1.1 percentage points over the last five years. This raises questions about the company’s expense base because its revenue growth should have given it leverage on its fixed costs, resulting in better economies of scale and profitability. Henry Schein’s poor performance shows that costs were rising and it couldn’t pass them on to its customers.
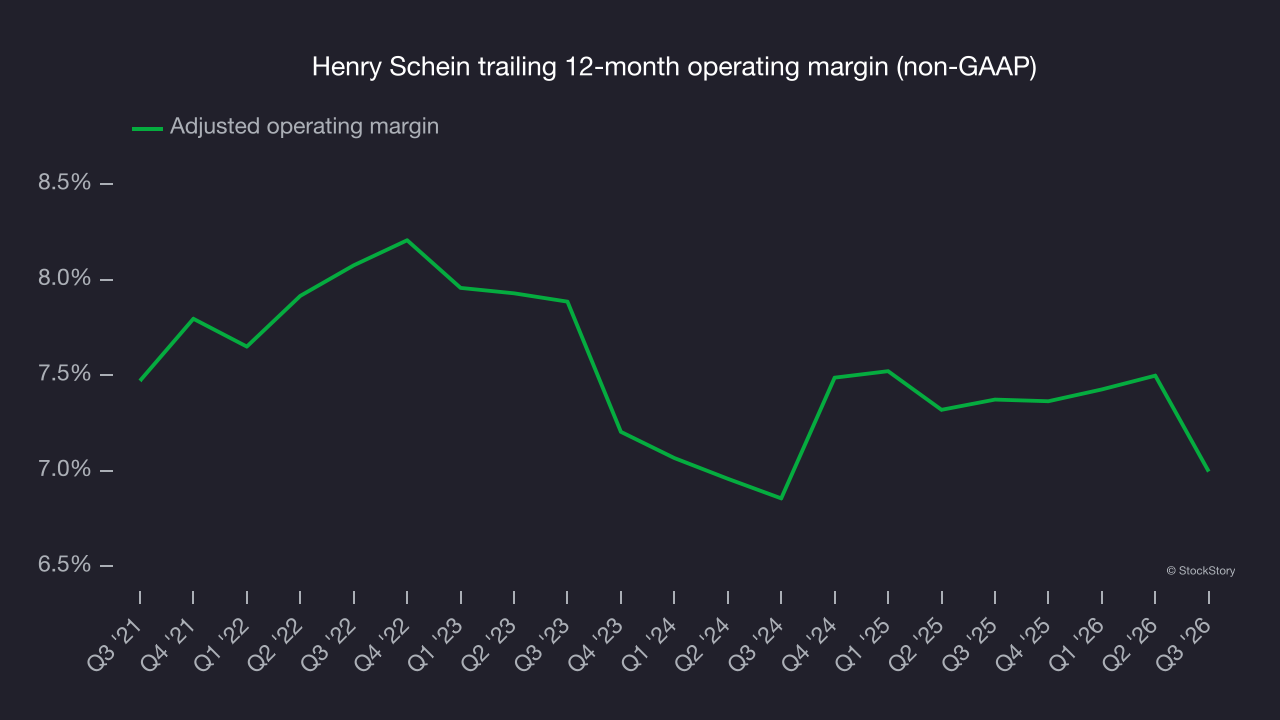
In Q3, Henry Schein generated an adjusted operating margin of 5.8%, down 2 percentage points year on year. This small reduction indicates the company’s overall cost structure has been relatively stable.
Earnings per share
We track the long-term change in earnings per share (EPS) for the same reason as long-term revenue growth. Compared to revenue, however, EPS highlights whether a company’s growth is profitable.
Henry Schein’s unimpressive 4.3% annual EPS growth over the last five years aligns with its revenue performance. This tells us it maintained its per-share profitability as it expanded.
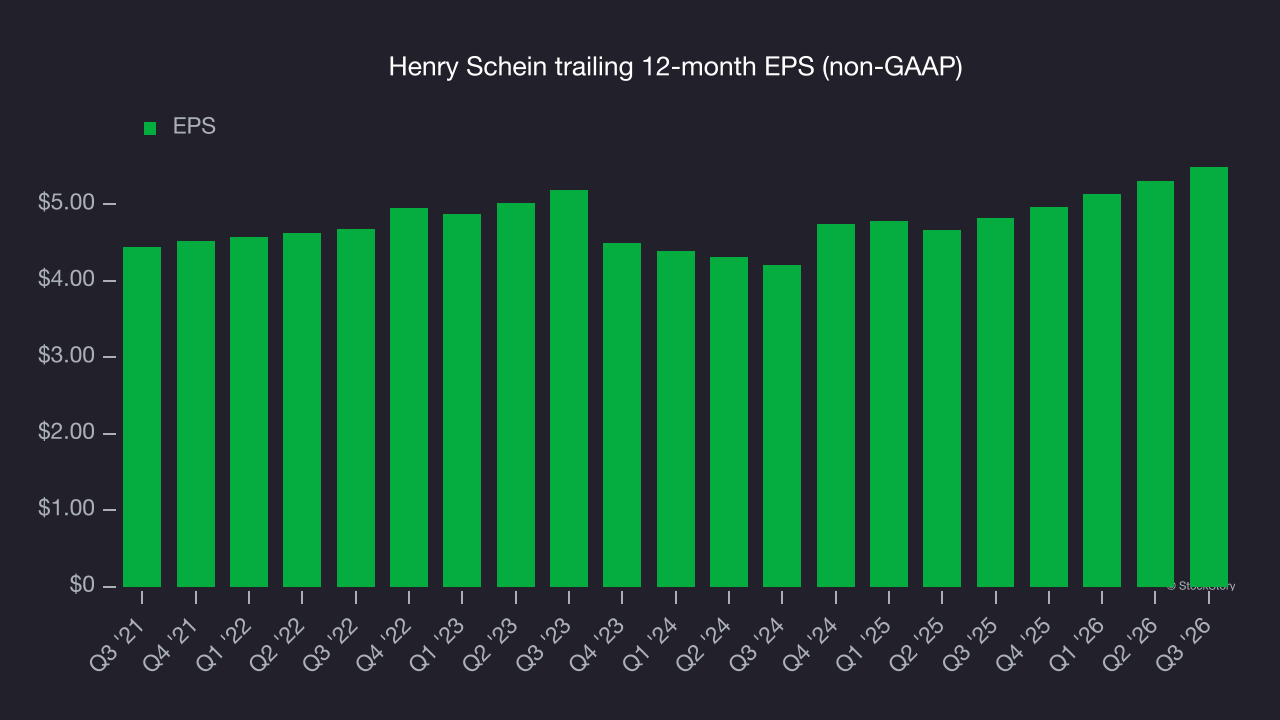
In Q3, Henry Schein reported adjusted EPS of $1.56, up from $1.38 in the same quarter last year. This result comfortably beat analysts’ consensus estimates. Over the next 12 months, Wall Street expects Henry Schein’s full-year EPS to grow 5.8% from $5.49 to $5.81, according to S&P.
Key takeaways from Henry Schein’s Q3 results
Henry Schein’s earnings and outlook provided the key positives in its Q3 results: EPS beat analysts’ consensus estimates, and full-year EPS guidance topped Wall Street’s consensus. Revenue, however, was in line with expectations. The market seemed to be hoping for more, with shares edging lower 1.8% to $85.08 immediately after the results.
When assessing Henry Schein as an investment, consider its valuation, business quality and latest quarterly results. Read the free full research report for more on these factors.