Aerospace and defense company TransDigm (NYSE: TDG) announced better-than-expected revenue in calendar Q3 2026 (fiscal Q4 2026), with revenue up 22.6% year on year to $2.99 billion. The company’s full-year revenue guidance of $12.05 billion at the midpoint came in 2.5% above analysts’ consensus estimates. Its non-GAAP profit of $12.44 per share was 1.9% above analysts’ consensus estimates.
For more on TransDigm, read our full research report for free.
TransDigm (TDG) Q3 CY2026 highlights:
- Revenue $2.99 billion vs S&P analysts’ consensus estimates of $2.95 billion (22.6% year-on-year growth, 1.5% beat)
- Adjusted EPS $12.44 vs S&P analysts’ consensus estimates of $12.21 (1.9% beat)
- Adjusted EBITDA $1.58 billion vs analysts’ consensus estimates of $1.54 billion (53% margin, 2.5% beat)
- Adjusted EPS guidance $47.52 at the midpoint for fiscal 2027, missing analysts’ consensus estimates by 2.3%
- EBITDA guidance $6.27 billion at the midpoint for fiscal 2027, above analysts’ consensus estimates of $6.15 billion
- Operating margin 45.6%, down from 47.6% in the same quarter last year
- Organic revenue rose 14% year on year (beat)
- Market capitalization $67.37 billion
Mr. Lisman stated, "We are issuing full year fiscal 2027 guidance today, which reflects our current expectations for the year. We are well-positioned for continued growth as we head into our fiscal 2027 across all three of our primary end markets."
Revenue growth
A company’s long-term revenue performance is one signal of its overall quality. Even a poor business can perform well for one or two quarters, but a top-tier one grows for years. TransDigm’s 17.1% annualized revenue growth over the last five years was strong. Its growth surpassed the average industrials company and shows its offerings resonate with customers.
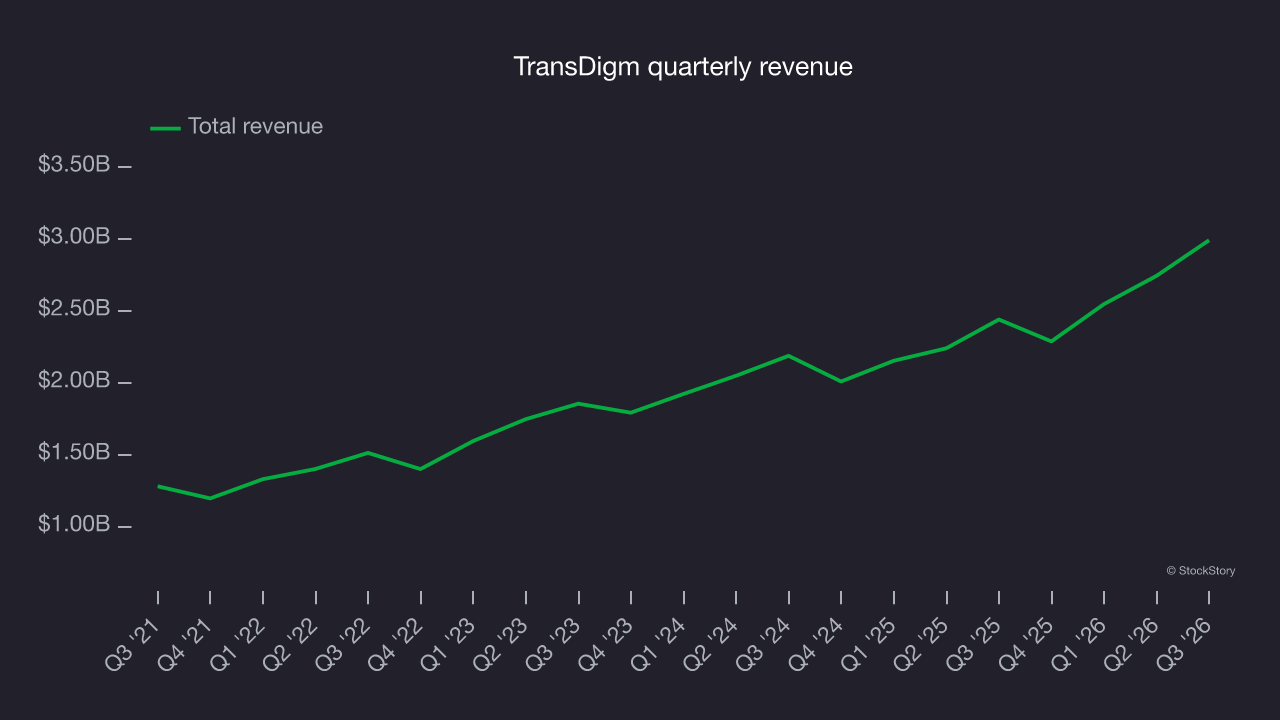
Long-term growth matters most, but within industrials, a half-decade historical view may miss cycles, industry trends or a company capitalizing on catalysts such as a new contract win or a successful product line. TransDigm’s annualized revenue growth of 15.3% over the last two years is below its five-year trend, but the results still suggest healthy demand. 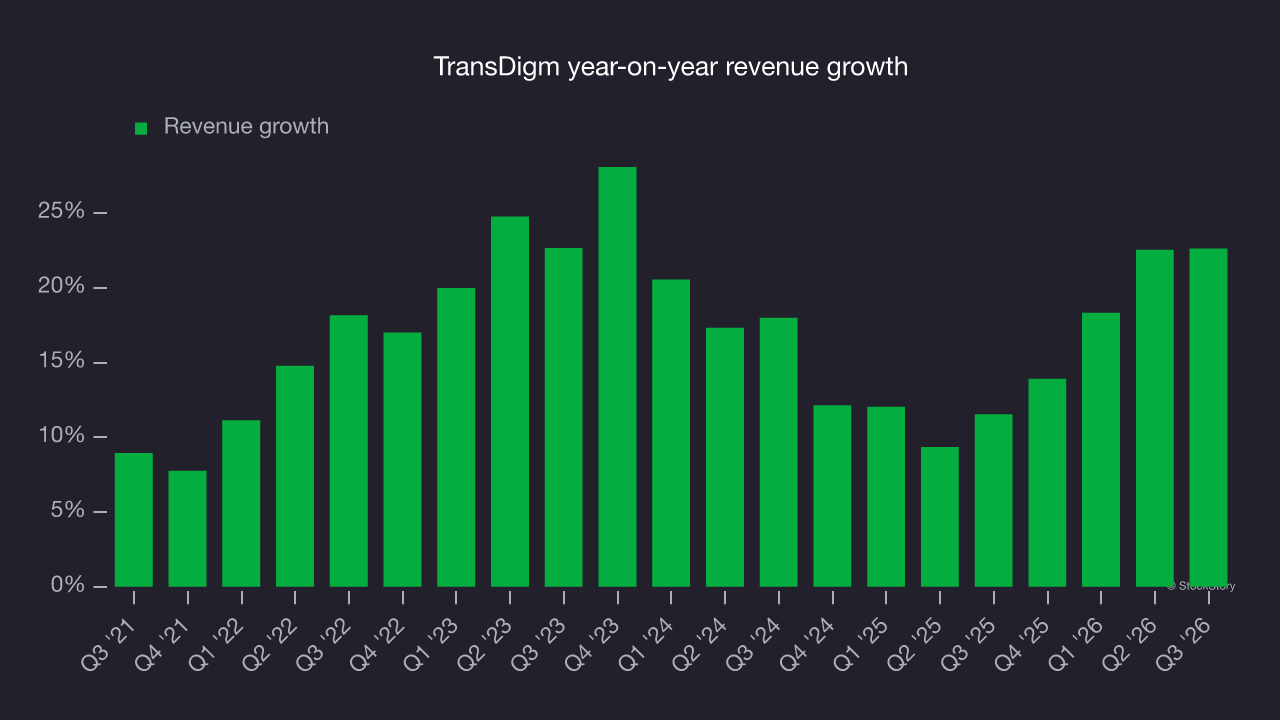
TransDigm also reports organic revenue, which strips out one-time events like acquisitions and currency fluctuations that don’t accurately reflect its fundamentals. Over the last two years, TransDigm’s organic revenue averaged 9.5% year-on-year growth. Total revenue growth outpaced organic growth over that period, indicating that a combination of acquisitions and foreign exchange rates boosted its headline results. 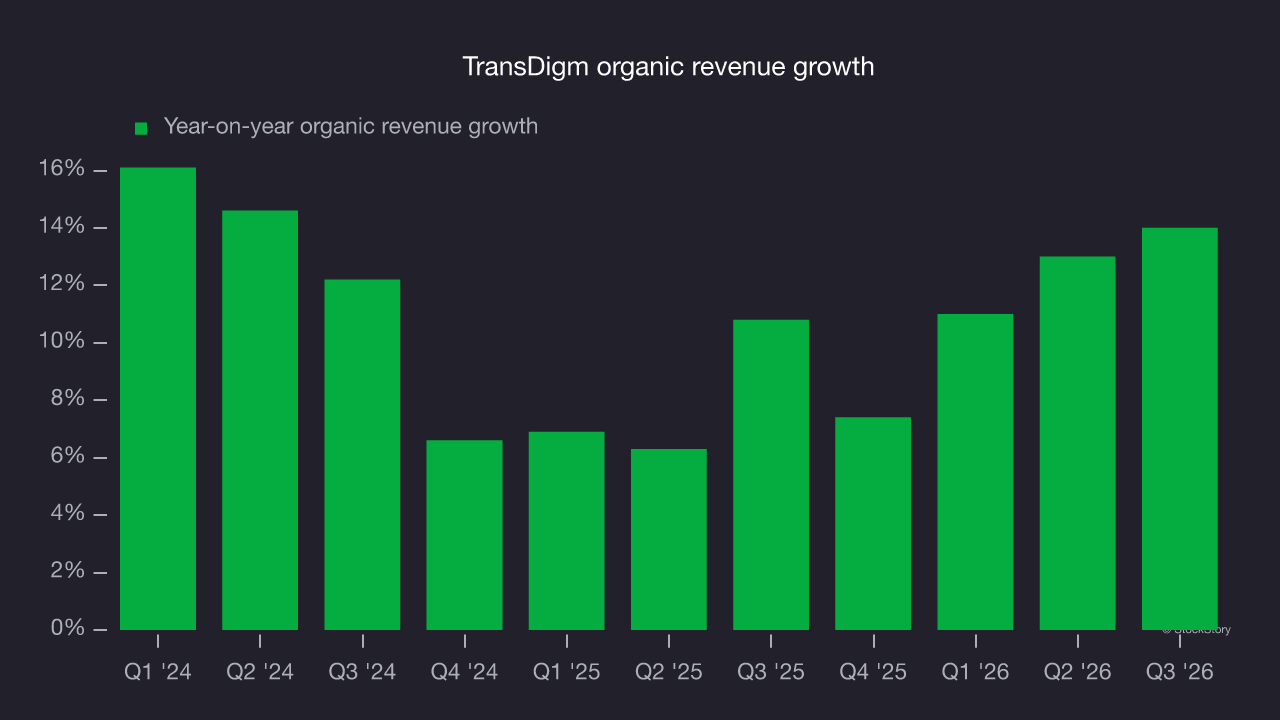
This quarter, TransDigm reported strong year-on-year revenue growth of 22.6%, and its $2.99 billion of revenue topped Wall Street’s consensus estimates by 1.5%.
Looking ahead, sell-side analysts expect revenue to grow 12.3% over the next 12 months, according to S&P, a slight deceleration versus the last two years. Still, this projection is strong given its scale and implies the market is forecasting success for its products and services.
Operating margin
Over the last five years, TransDigm’s operating margin rose by 4.8 percentage points. This improvement shows its costs declined relative to revenue. Its trailing 12-month operating margin was 45.6%.
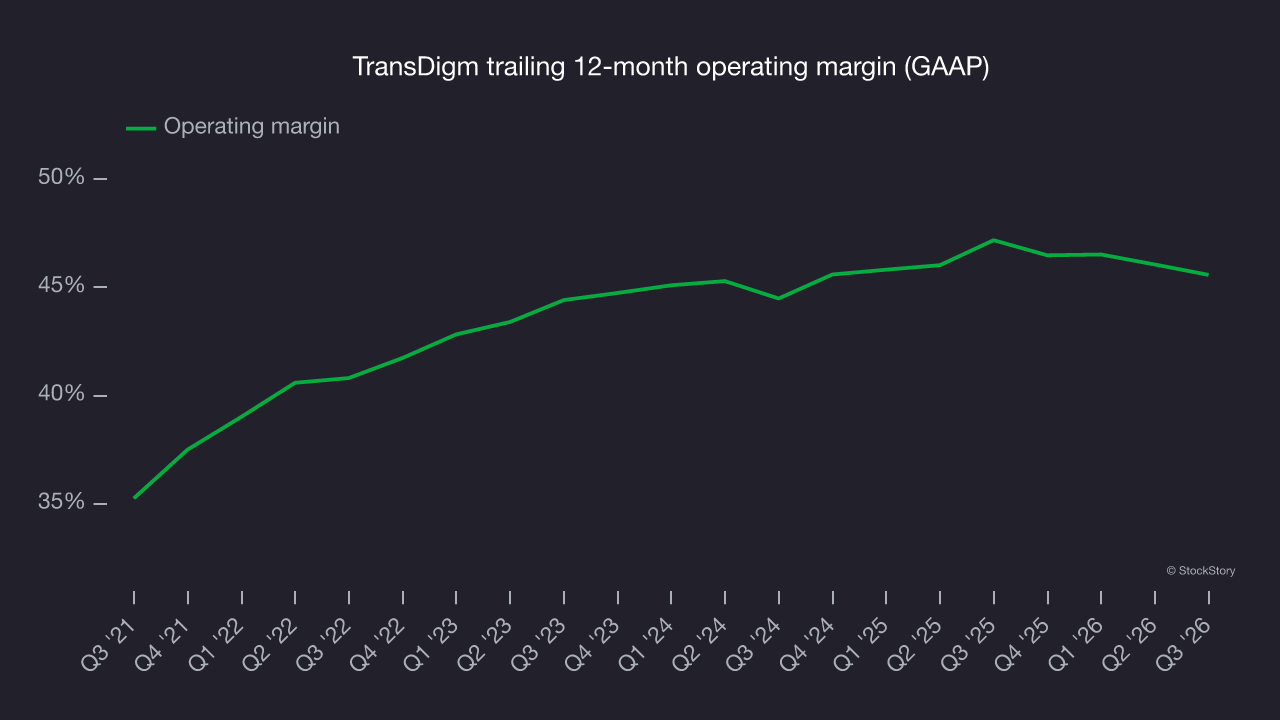
In Q3, TransDigm generated an operating profit margin of 45.6%, down 2 percentage points year on year. This modest reduction indicates the company’s overall cost structure has been relatively stable.
Earnings per share
We track the long-term change in earnings per share, or EPS, for the same reason as long-term revenue growth. Compared to revenue, however, EPS highlights whether a company’s growth is profitable.
TransDigm’s EPS grew at a 27.8% compounded annual growth rate over the last five years, higher than its 17.1% annualized revenue growth. This indicates the company became more profitable on a per-share basis as it expanded.
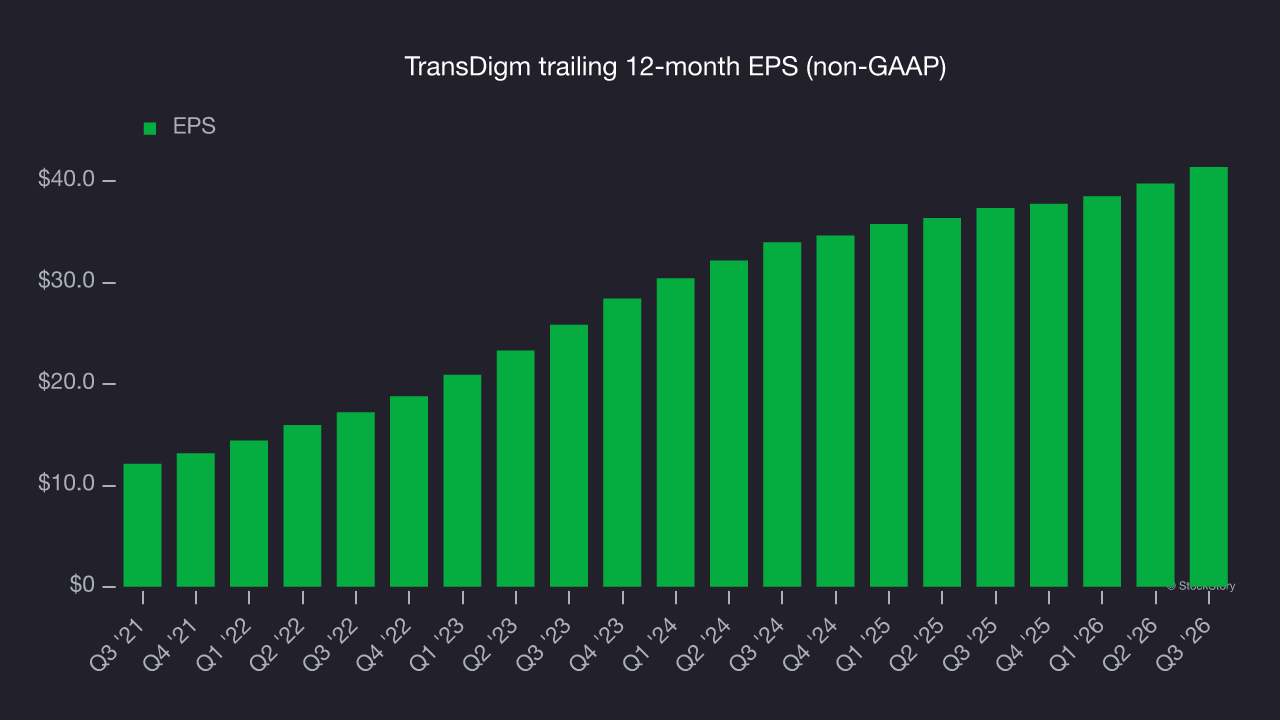
A closer look at TransDigm’s earnings quality helps explain its performance. As mentioned earlier, TransDigm’s operating margin declined this quarter but expanded by 4.8 percentage points over the last five years. Its share count also shrank by 2.9%, and these factors together are positive signs for shareholders because improving profitability and share buybacks boost EPS growth relative to revenue growth. 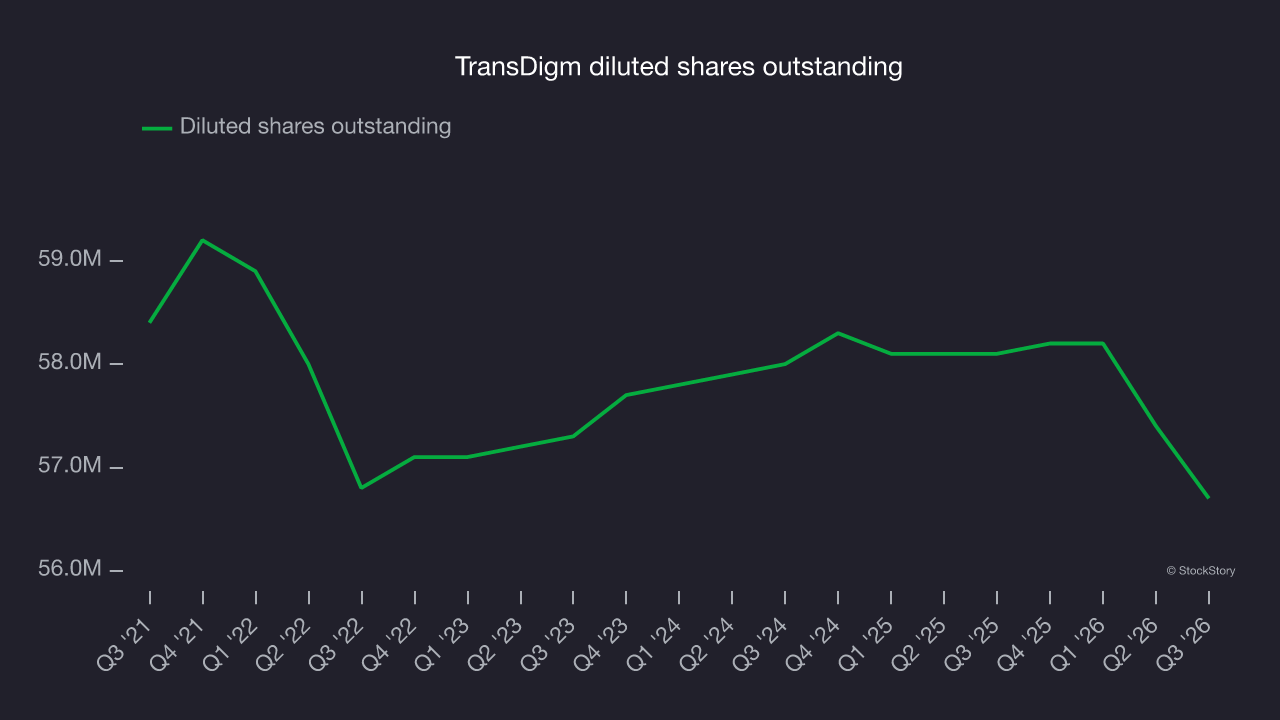
As with revenue, we analyze EPS over a more recent period because it can provide insight into an emerging theme or development for the business.
For TransDigm, its two-year annual EPS growth of 10.4% was lower than its five-year trend. This was underwhelming, but the company performed well on other measures of financial health.
In Q3, TransDigm reported adjusted EPS of $12.44, up from $10.82 in the same quarter last year. This result beat analysts’ consensus estimates by 1.9%. Over the next 12 months, Wall Street expects TransDigm’s full-year EPS to grow 17.6% from $41.39 to $48.68, according to S&P.
Key takeaways from TransDigm’s Q3 results
Full-year guidance was a bright spot for TransDigm, with both revenue and EBITDA forecasts exceeding analysts’ consensus estimates. That made for a decent quarter with some key metrics above expectations, but investors were likely hoping for more. Shares edged lower 1.8% to $1,196 immediately after the results.
Considering an investment in TransDigm? The decision should take into account the bigger picture of valuation and business quality, as well as the latest earnings. Read the full research report here (it’s free).