


Measurement equipment distributor Transcat (NASDAQ: TRNS) beat Wall Street’s revenue expectations in Q3 CY2025, with sales up 21.3% year on year to $82.27 million. Its non-GAAP profit of $0.44 per share was 9.1% below analysts’ consensus estimates.
Is now the time to buy Transcat? Find out by accessing our full research report, it’s free for active Edge members.
Transcat (TRNS) Q3 CY2025 Highlights:
- Revenue: $82.27 million vs analyst estimates of $79.51 million (21.3% year-on-year growth, 3.5% beat)
- Adjusted EPS: $0.44 vs analyst expectations of $0.48 (9.1% miss)
- Adjusted EBITDA: $12.12 million vs analyst estimates of $11.61 million (14.7% margin, 4.4% beat)
- Operating Margin: 4.3%, down from 5.5% in the same quarter last year
- Free Cash Flow Margin: 10.3%, up from 4.2% in the same quarter last year
- Market Capitalization: $677 million
"Transcat had another strong quarter of revenue and Adjusted EBITDA* performance driven by double-digit service revenue growth and continued high demand in our rentals channel,” commented Lee D. Rudow, President and CEO.
Company Overview
Serving the pharmaceutical, industrial manufacturing, energy, and chemical process industries, Transcat (NASDAQ: TRNS) provides measurement instruments and supplies.
Revenue Growth
A company’s long-term sales performance can indicate its overall quality. Any business can have short-term success, but a top-tier one grows for years. Luckily, Transcat’s sales grew at an excellent 12.3% compounded annual growth rate over the last five years. Its growth beat the average industrials company and shows its offerings resonate with customers.
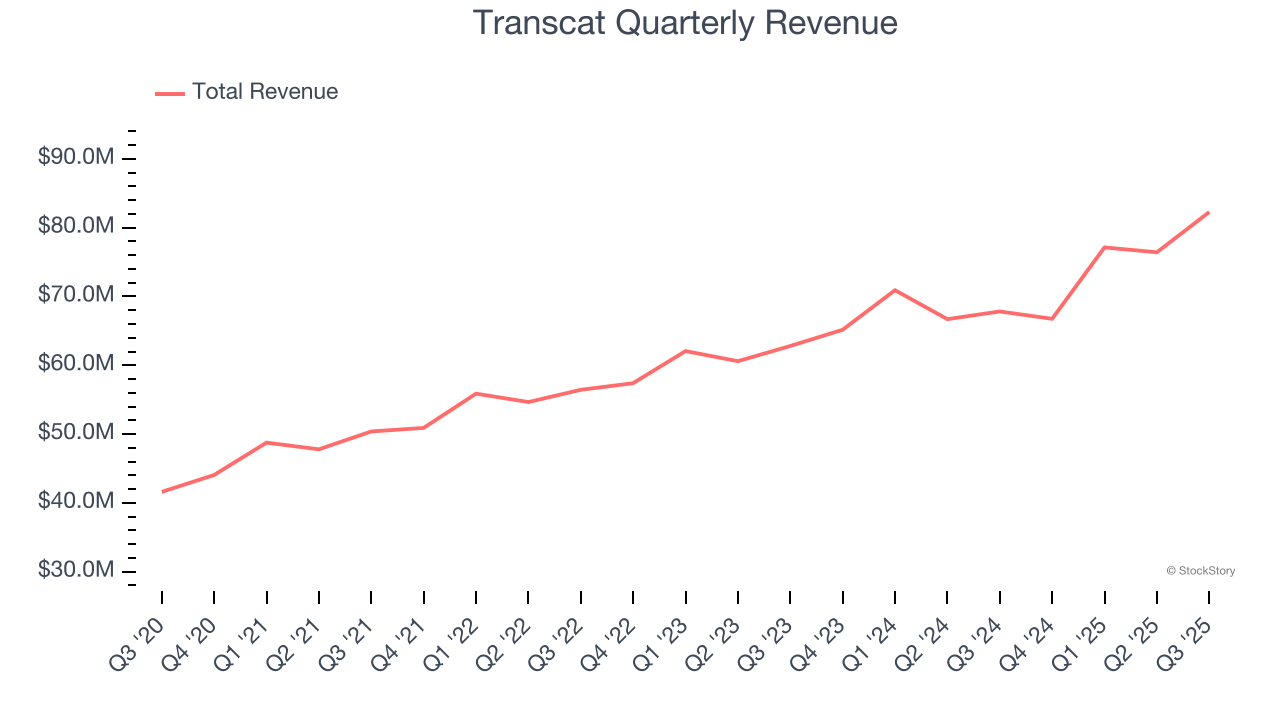
We at StockStory place the most emphasis on long-term growth, but within industrials, a half-decade historical view may miss cycles, industry trends, or a company capitalizing on catalysts such as a new contract win or a successful product line. Transcat’s annualized revenue growth of 11.6% over the last two years aligns with its five-year trend, suggesting its demand was predictably strong. 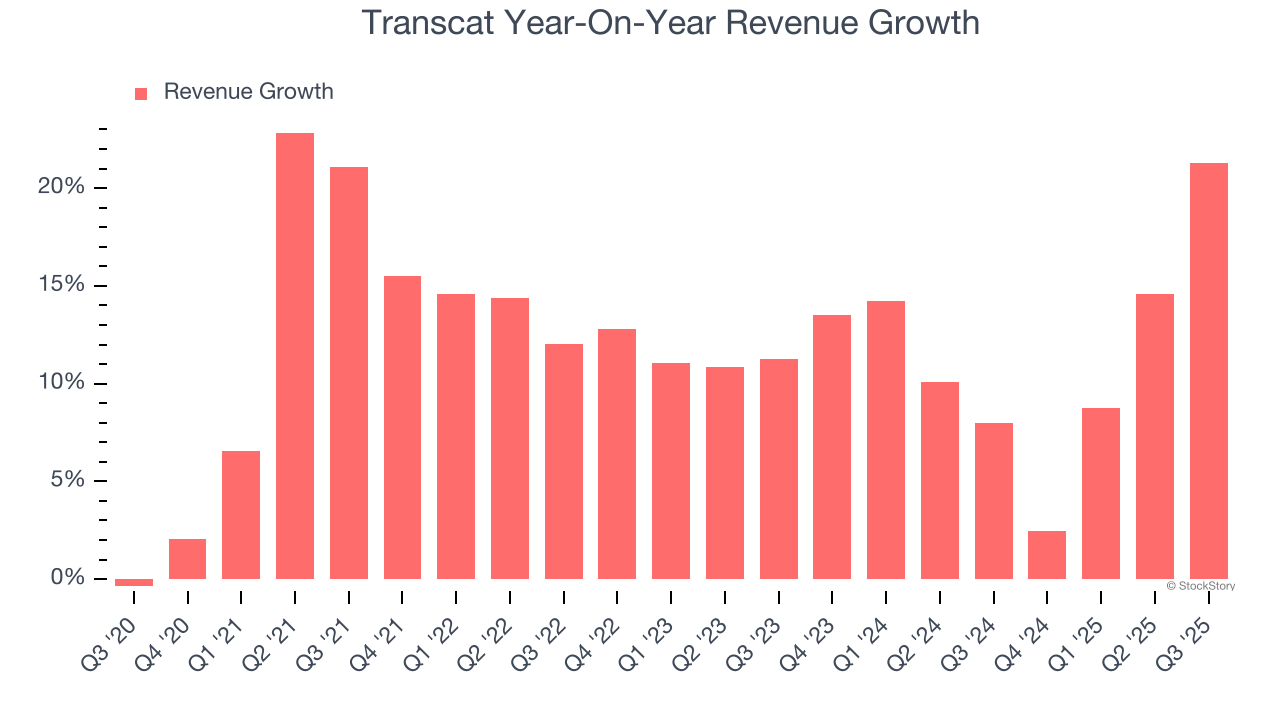
This quarter, Transcat reported robust year-on-year revenue growth of 21.3%, and its $82.27 million of revenue topped Wall Street estimates by 3.5%.
Looking ahead, sell-side analysts expect revenue to grow 11.5% over the next 12 months, similar to its two-year rate. This projection is admirable and implies the market is forecasting success for its products and services.
The 1999 book Gorilla Game predicted Microsoft and Apple would dominate tech before it happened. Its thesis? Identify the platform winners early. Today, enterprise software companies embedding generative AI are becoming the new gorillas. a profitable, fast-growing enterprise software stock that is already riding the automation wave and looking to catch the generative AI next.
Operating Margin
Operating margin is a key measure of profitability. Think of it as net income - the bottom line - excluding the impact of taxes and interest on debt, which are less connected to business fundamentals.
Transcat was profitable over the last five years but held back by its large cost base. Its average operating margin of 6.9% was weak for an industrials business.
Analyzing the trend in its profitability, Transcat’s operating margin decreased by 2.5 percentage points over the last five years. This raises questions about the company’s expense base because its revenue growth should have given it leverage on its fixed costs, resulting in better economies of scale and profitability. Transcat’s performance was poor no matter how you look at it - it shows that costs were rising and it couldn’t pass them onto its customers.
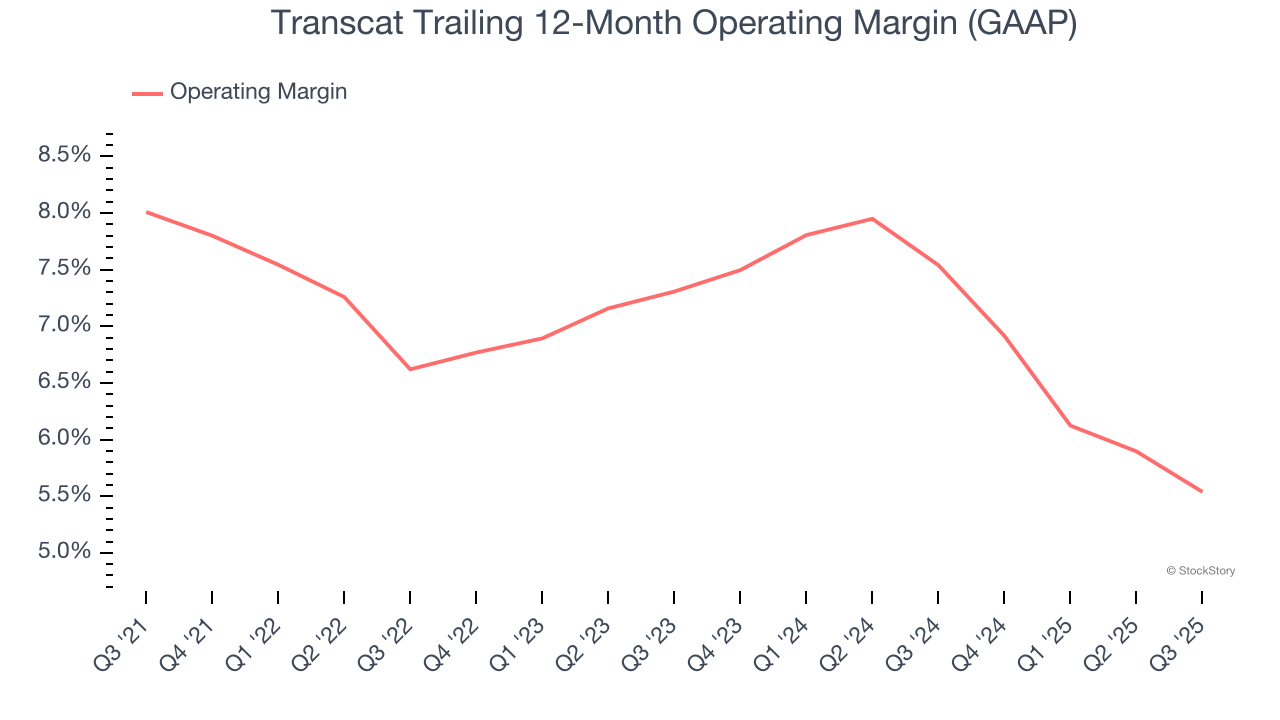
In Q3, Transcat generated an operating margin profit margin of 4.3%, down 1.2 percentage points year on year. Conversely, its revenue and gross margin actually rose, so we can assume it was less efficient because its operating expenses like marketing, R&D, and administrative overhead grew faster than its revenue.
Earnings Per Share
Revenue trends explain a company’s historical growth, but the long-term change in earnings per share (EPS) points to the profitability of that growth – for example, a company could inflate its sales through excessive spending on advertising and promotions.
Transcat’s EPS grew at a spectacular 17.3% compounded annual growth rate over the last five years, higher than its 12.3% annualized revenue growth. However, we take this with a grain of salt because its operating margin didn’t improve and it didn’t repurchase its shares, meaning the delta came from reduced interest expenses or taxes.
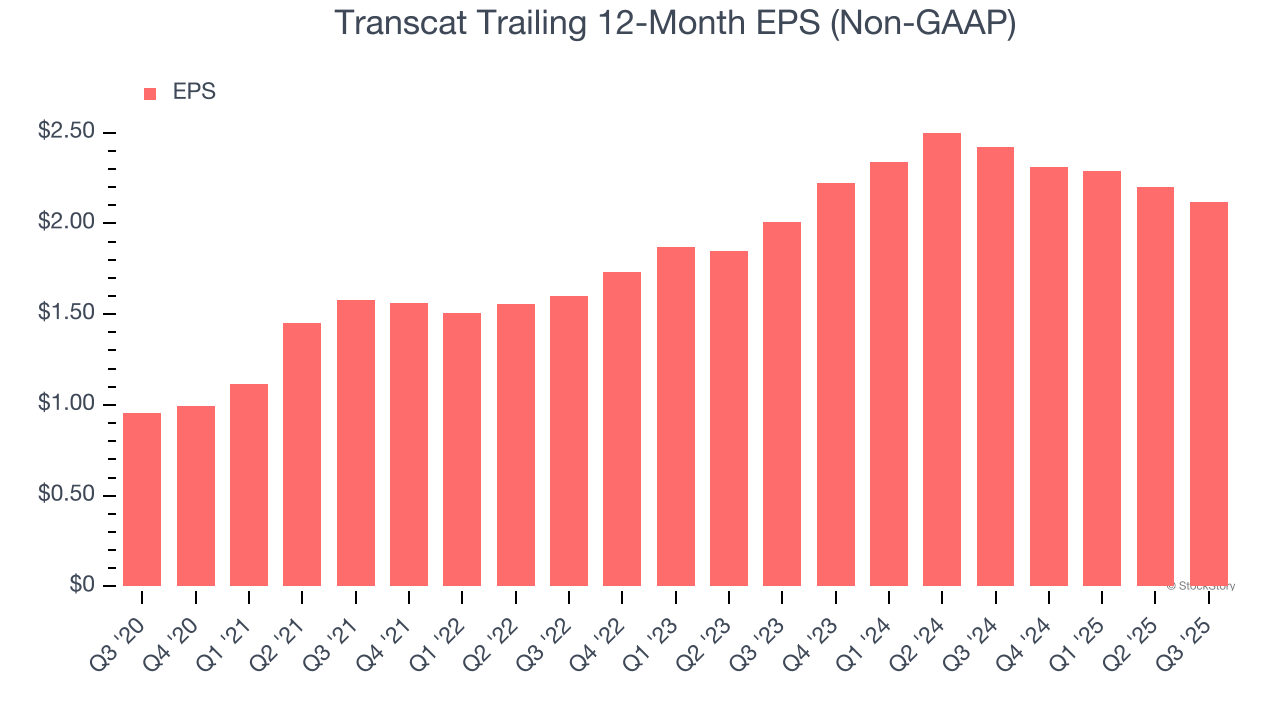
Like with revenue, we analyze EPS over a more recent period because it can provide insight into an emerging theme or development for the business.
Transcat’s two-year annual EPS growth of 2.7% was subpar and lower than its 11.6% two-year revenue growth.
We can take a deeper look into Transcat’s earnings to better understand the drivers of its performance. Transcat’s operating margin has declined over the last two yearswhile its share count has grown 18.3%. This means the company not only became less efficient with its operating expenses but also diluted its shareholders. 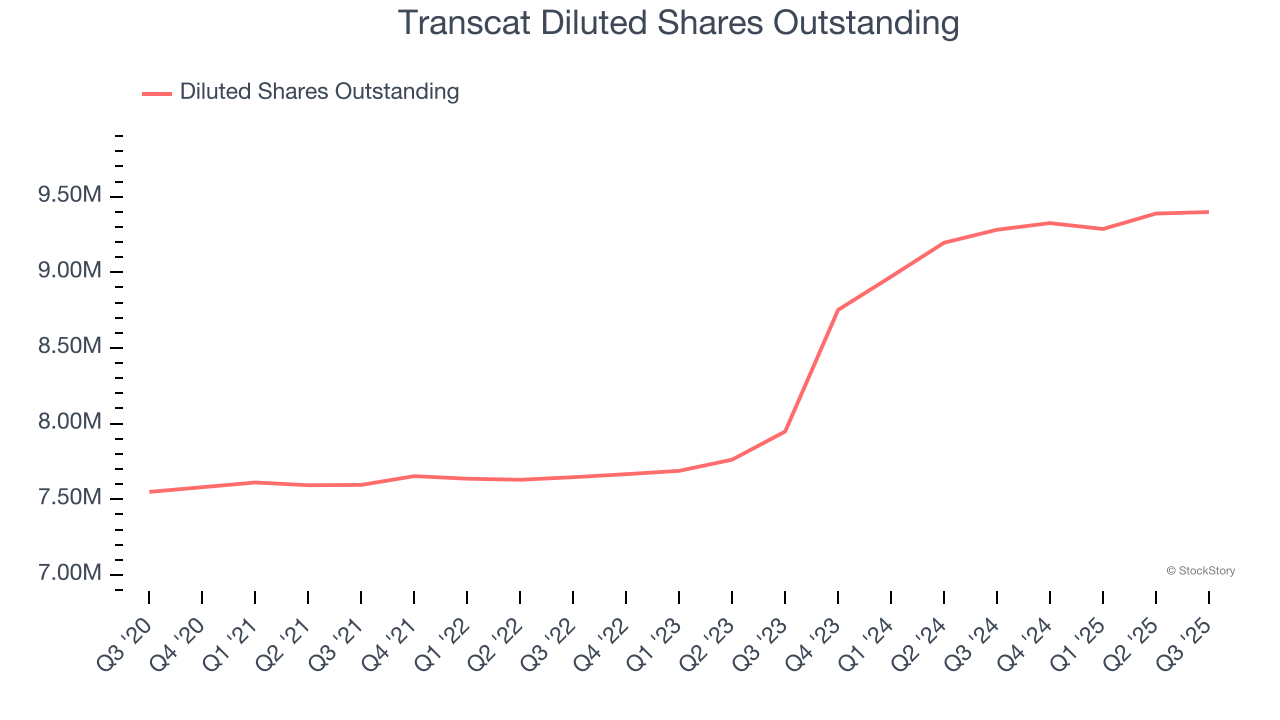
In Q3, Transcat reported adjusted EPS of $0.44, down from $0.52 in the same quarter last year. This print missed analysts’ estimates, but we care more about long-term adjusted EPS growth than short-term movements. Over the next 12 months, Wall Street expects Transcat’s full-year EPS of $2.12 to grow 9.5%.
Key Takeaways from Transcat’s Q3 Results
We enjoyed seeing Transcat beat analysts’ revenue expectations this quarter. We were also glad its EBITDA outperformed Wall Street’s estimates. On the other hand, its EPS missed. Overall, this print had some key positives. The stock traded up 3.7% to $73 immediately following the results.
Is Transcat an attractive investment opportunity at the current price? We think that the latest quarter is only one piece of the longer-term business quality puzzle. Quality, when combined with valuation, can help determine if the stock is a buy. We cover that in our actionable full research report which you can read here, it’s free for active Edge members.


