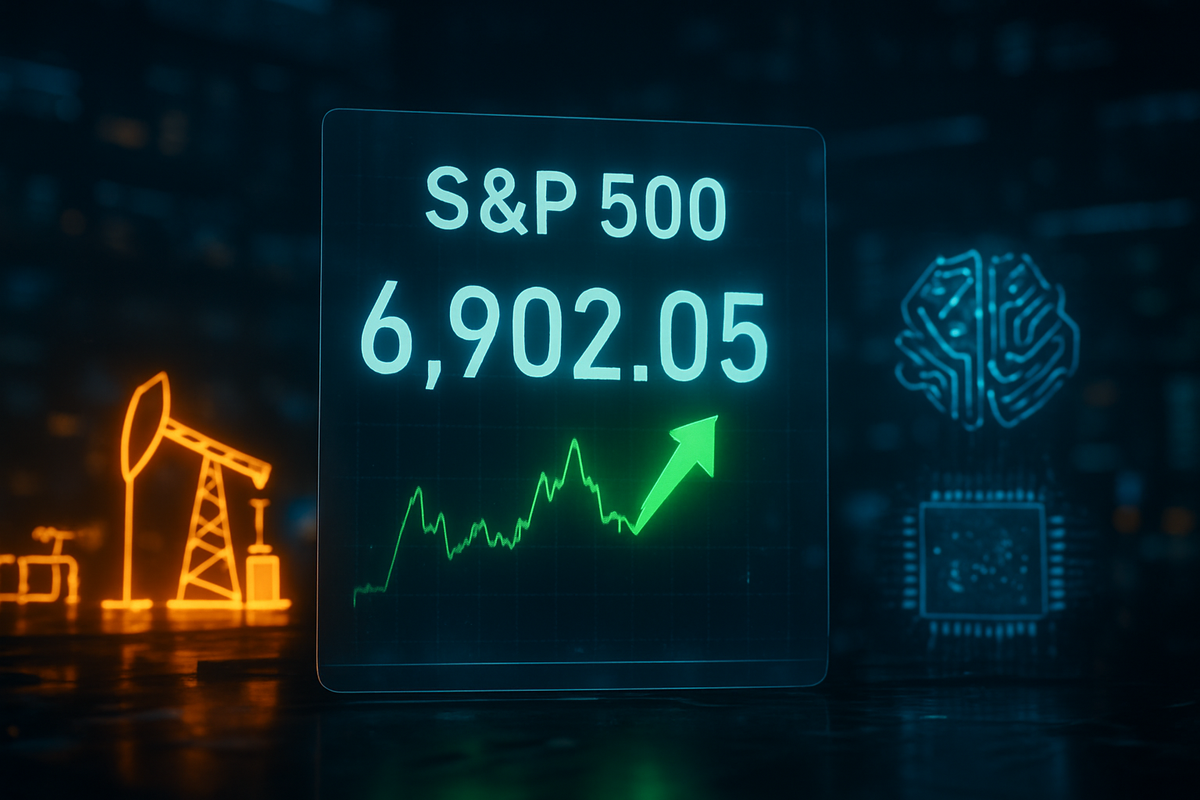
The S&P 500 index managed to eke out a modest gain on Tuesday, January 6, 2026, closing at 6,902.05—up 43.58 points or 0.64%. While the green finish suggests a resilient market, the day’s trading was defined by significant wavering and a fading of the "risk-on" sentiment that had initially propelled futures higher in the premarket session. Investors are increasingly grappling with a market that many analysts describe as "priced for perfection," leading to intraday volatility as the initial burst of New Year optimism meets the reality of high valuations and geopolitical shifts.
The session was a tug-of-war between a surging energy sector and a cooling technology landscape. Early momentum, which saw S&P 500 futures peak at 6,940, quickly unraveled as institutional buyers hesitated to commit fresh capital at these record levels. This "wobble" in early trading reflected a broader caution regarding the sustainability of the current bull run, especially as the traditional "Santa Claus rally" failed to provide its typical year-end boost, leaving the "January Barometer" as the next critical psychological milestone for the street.
Energy Surge Meets Tech Fatigue: A Day of Intraday Reversals
The primary catalyst for the day’s market movement was a dramatic geopolitical development over the weekend: the reported capture of Venezuelan leader Nicolás Maduro by U.S. forces. This event sent shockwaves through the energy markets, with U.S. crude oil prices climbing to approximately $58.32 per barrel. Investors pivoted sharply toward domestic energy giants, betting on a long-term revitalization of the Venezuelan oil industry under new influence. This geopolitical shock provided the necessary floor for the S&P 500, allowing it to recover from a mid-morning dip where it had briefly touched the flat line.
While energy stocks provided the lift, the technology sector showed signs of exhaustion. The kickoff of the annual CES trade show in Las Vegas, typically a hotbed for tech optimism, failed to ignite a broad rally. Instead, the market witnessed a visible rotation out of "crowded" megacap tech plays and into cyclical sectors and small-caps. This shift was underscored by the Russell 2000 index, which outperformed its larger peers with a 1.60% gain, suggesting that investors are seeking value in areas of the market that have lagged behind the AI-driven surge of 2025.
The day’s timeline was marked by three distinct phases: a premarket spike driven by energy futures, a mid-day slump as tech stocks faced selling pressure, and a late-afternoon recovery as banking and industrial stocks joined the energy-led climb. This roller-coaster performance highlights a market that is sensitive to headlines but lacks a clear, unified direction as it navigates the first full week of the new year.
Winners and Losers: Energy Giants Lead While Tech Titans Stumble
The energy sector was the undisputed winner of the day. Halliburton (NYSE: HAL) led the charge with a staggering 7.8% surge, as investors anticipated a massive demand for oilfield services in a potentially reopened Venezuelan market. Chevron (NYSE: CVX) followed closely with a 5.1% gain, while Exxon Mobil (NYSE: XOM) added 2.2%. These companies are positioned to benefit not only from higher immediate crude prices but also from the potential for new long-term drilling contracts and infrastructure projects in South America.
On the other side of the ledger, the technology sector presented a mixed and somewhat disappointing picture. Nvidia (NASDAQ: NVDA), the bellwether for the AI era, announced its new "Drive AGX Thor" chips for robotaxis at CES. However, after an initial pop, the stock struggled to maintain momentum, finishing with a modest 1.4% gain as traders took profits following its historic run-up over the past year. Even more telling was the performance of Microsoft (NASDAQ: MSFT), which slipped 0.2% as investors questioned whether the premium valuation of the software giant could be sustained amidst a shifting interest rate environment.
The banking sector also found some footing, with major institutions benefiting from the rotation into cyclicals. Investors are betting that if the economy remains resilient despite higher-than-ideal inflation, the "higher-for-longer" interest rate environment will continue to pad the net interest margins of traditional lenders. This helped the Dow Jones Industrial Average (DJIA) outperform the S&P 500, closing at a record high of 48,977.18.
The Valuation Wall and the Midterm Shadow
The wavering performance of the S&P 500 today fits into a broader narrative of a market hitting a "valuation wall." With a forward P/E ratio of 23.88 and a Shiller CAPE ratio nearing 40, the index is trading at levels historically associated with limited upside and increased sensitivity to negative news. Analysts from major firms have warned that the market is "priced for perfection," meaning any slight miss in economic data or a shift in geopolitical stability could trigger a significant correction.
Furthermore, 2026 is a midterm election year in the United States, a period that historically brings increased volatility. Historical precedents show that the S&P 500 often experiences a peak-to-trough decline of roughly 18% during midterm years as policy uncertainty takes center stage. Today's intraday wavering may be an early symptom of this cyclical anxiety, as traders begin to price in the potential for legislative gridlock or shifts in regulatory oversight following the upcoming elections.
The broader economic backdrop remains complicated. With unemployment at a four-year high of 4.6% and inflation lingering at a "sticky" 2.7%, the Federal Reserve is in a difficult position. The market's inability to sustain a risk rally today suggests that investors are no longer blindly buying every dip, but are instead waiting for concrete evidence that the "soft landing" scenario is still on track.
What Comes Next: All Eyes on the Labor Market
The short-term direction of the market will likely be determined by the upcoming Non-Farm Payrolls report due this Friday, January 9. This data point will be crucial in determining whether the recent uptick in unemployment is a sign of a cooling economy or a more concerning structural shift. If the labor market shows further signs of distress, the S&P 500 may struggle to maintain its 6,900 level, as the fear of a recession could outweigh the benefits of potential Fed rate cuts.
In the coming weeks, the continuation of the CES trade show and the start of the Q4 2025 earnings season will provide more clarity. Investors will be looking for more than just AI hype; they will be demanding proof of monetization and margin expansion. Companies that fail to meet these high expectations may find themselves punished, further fueling the rotation into defensive and cyclical sectors.
Summary of the Market Outlook
Today’s session was a classic example of a market in transition. While the S&P 500 managed to nudge higher, the lack of conviction and the fading of the early risk rally serve as a warning sign. The energy sector's geopolitical boost provided a temporary reprieve, but the underlying concerns regarding tech valuations and economic health remain unresolved.
Moving forward, investors should watch for the "January Barometer"—the idea that the market's performance in the first month of the year often dictates its direction for the remaining eleven months. With the Santa Claus rally missing in action and the first week of January showing signs of exhaustion, the path to the 7,600 year-end target predicted by some analysts looks increasingly uphill. Caution and diversification into cyclicals may be the prudent path as the market navigates this period of high-altitude volatility.
This content is intended for informational purposes only and is not financial advice.