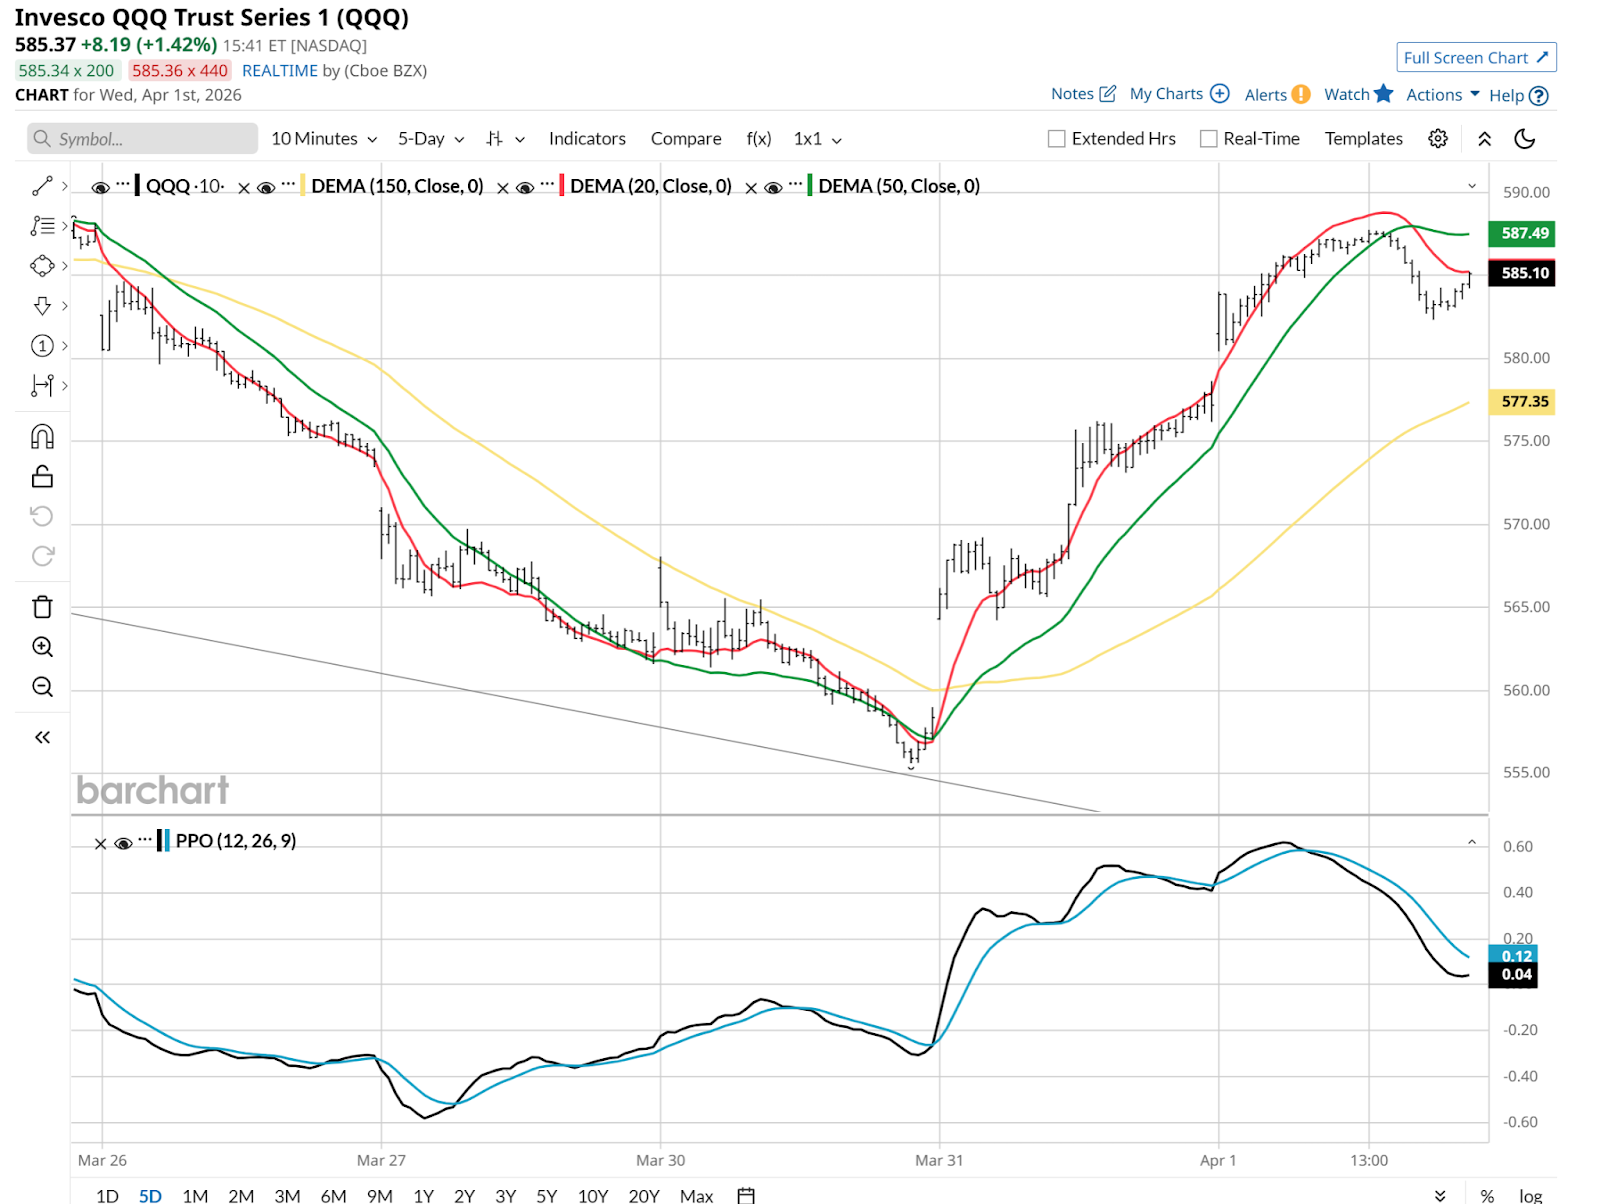
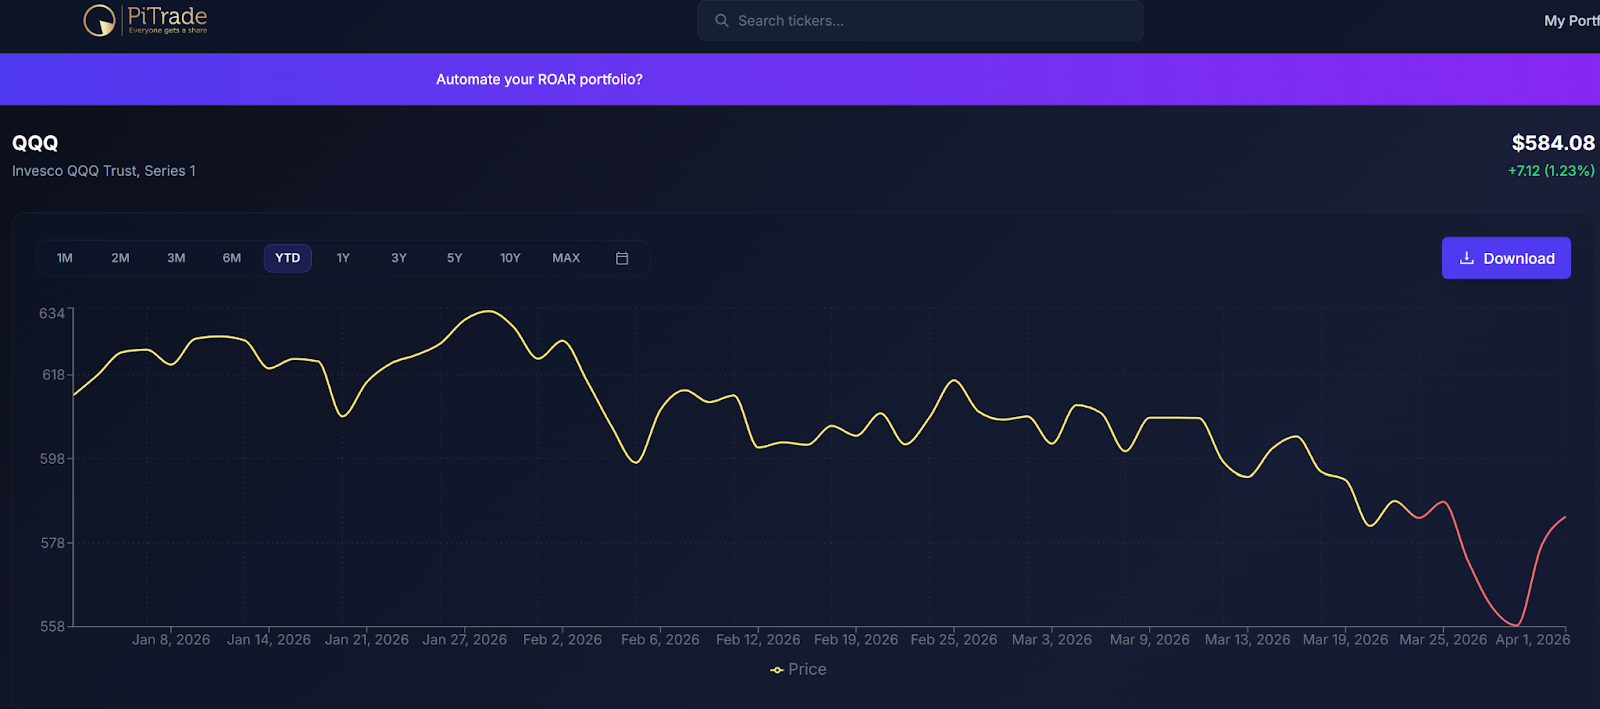
What a party the market had on Tuesday, March 31! The Nasdaq 100 ETF (QQQ) jumped 3.8%, then tacked on more gains Wednesday.
As this chart shows us, that brought QQQ’s price all the way back… to where it traded late last week. So that got me thinking: what does a 3% jump in a day from the sexiest ETF in history typically suggest will happen next?
As investors, we have to recognize that there are both historical facts and our interpretations of that history. In my case, the latter led me to instantly consider a 3% QQQ move in a single trading day to be much more symptomatic of a bear market than a bull market. But we are in neither right now.
QQQ fell about 10% before rallying for a couple of days. However, it should be noted that after a 10% decline in any investment, making back 5%, as QQQ roughly had done as of late Wednesday, is not the same as a regular 5% gain. To make this clear, think of it this way: for every $100 you had in QQQ, it dropped to $90. If you then make 5%, 5% on the remaining $90 is $4.50, not $5. A small difference, unless you add a bunch of zeroes!
So, have we found a floor? Is QQQ about to provide an early resurrection we can all marvel at? Or, is it bound for yet another technical pattern known as a “death cross?”
While a 3% single-day gain feels like a recovery, historical context suggests these massive swings are often a hallmark of a downtrend rather than the start of a sustained bull run. This is caused by high-stress market environments, which produce large moves in both directions.
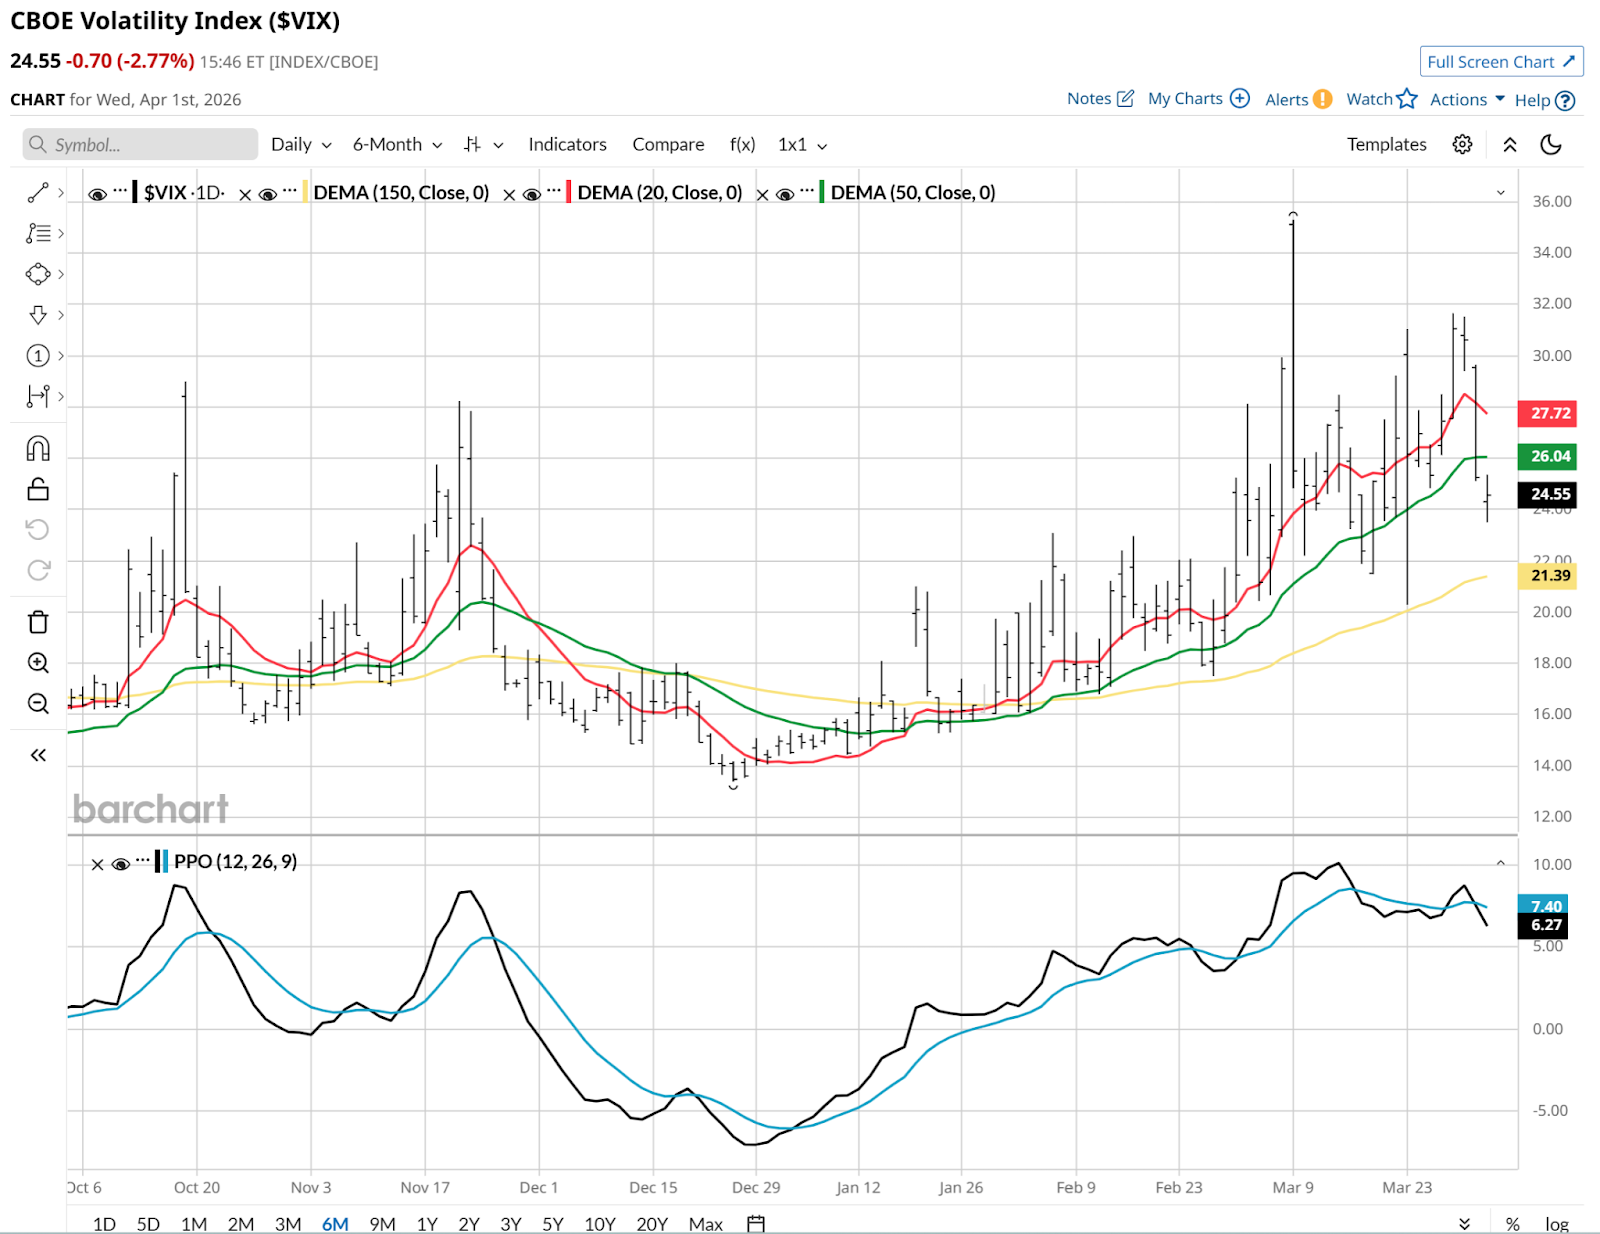
The CBOE Volatility Index ($VIX) tells the story of a stock market which has been settled until recently. Yet unsettled at the same time. Because after several months of small gyrations leading to zero return, the market made its move. Downward. But then, the bounce.
I compiled this table to see if my memory served correctly. I went back to the start of 2020, just before the COVID-19 pandemic. To me, that is when the modern era of investing started. And thus, any history prior to that is, to me, less relevant. Markets did not function as they do now prior to 2020.
It wasn’t COVID-19 per se, but the dramatic increase since that time in indexed S&P 500 ($SPX) investing and algorithmic trading, and the increased presence of retail traders. All of this gathered significant momentum during that crisis, but really accelerated in the aftermath. And it continues today.
The table shows every 3% single up day in QQQ since 2020, including Tuesday’s. I then figured out what the next 10% move in QQQ was following that one-day blast off. And how long it took to get there.
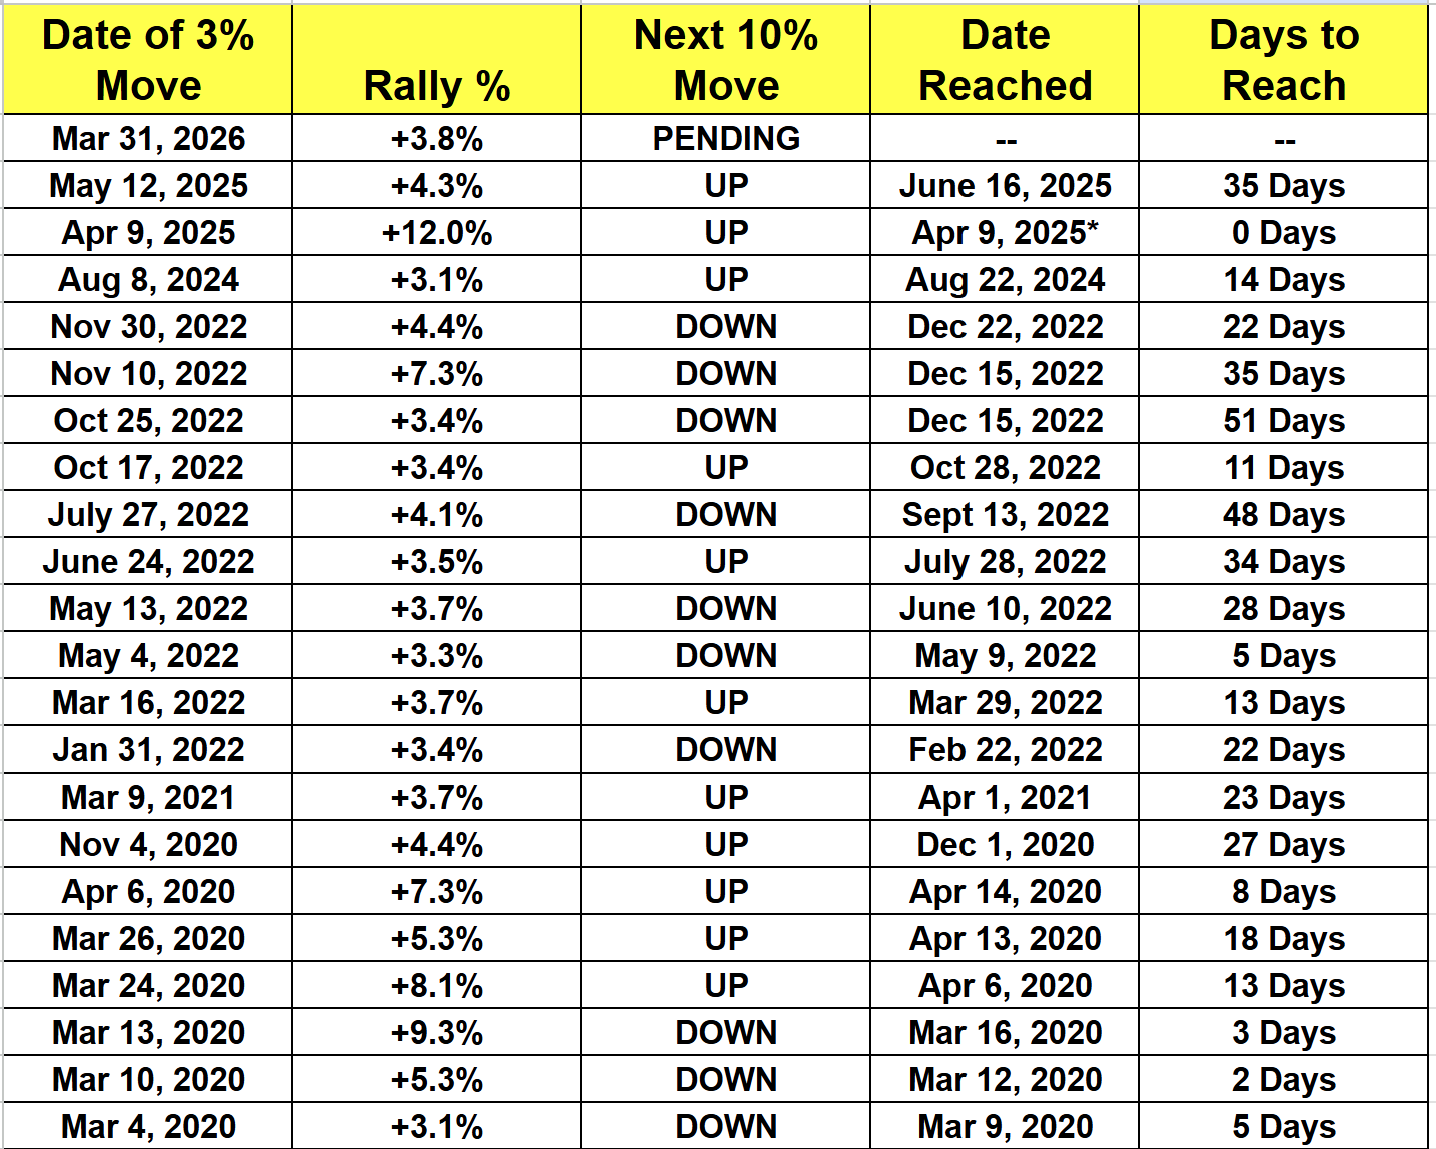
There were 10 cases in which the next 10% move was down, but 11 in which it was up. So if the downs win this time around, we’ll have a 50-50 situation.
But the real nuance here has to do with speed and voracity. And especially what the market’s surrounding environment was leading into the move. When we do that, a different picture emerges.
2020 was a case in which those rallies were wrapped tightly into one of the most shocking market environments ever. There were 3 big up AND down moves within a matter of weeks. And once QQQ found its footing around March 23 of that year, it was up, up, up, up, up, up. Literally, as the table shows. Five consecutive big one-day moves which resolved themselves to the upside (10% further move).
All of those moves, over the course of about 12 months. Frankly, I don’t see the Iran War and concern over the Strait of Hormuz equalling the drama of that 2020 period. But we’ll see.
Then came 2022, a rough year for stocks and bonds. In fact, the worst for that pair of major asset classes since the 1970s. 2022 saw a whopping 10 single-day 3% rallies in QQQ. Here’s what that looked like.
Over the past 3 years and 3 months, until Tuesday, there were only 3 big one-day QQQ moves. All resolved upward, with that ETF rallying another 10%. The big footnote there is that this has been the era of the AI trade. That essentially kicked off during Q4 2022. Now it is being threatened. So yes, the plot has thickened.
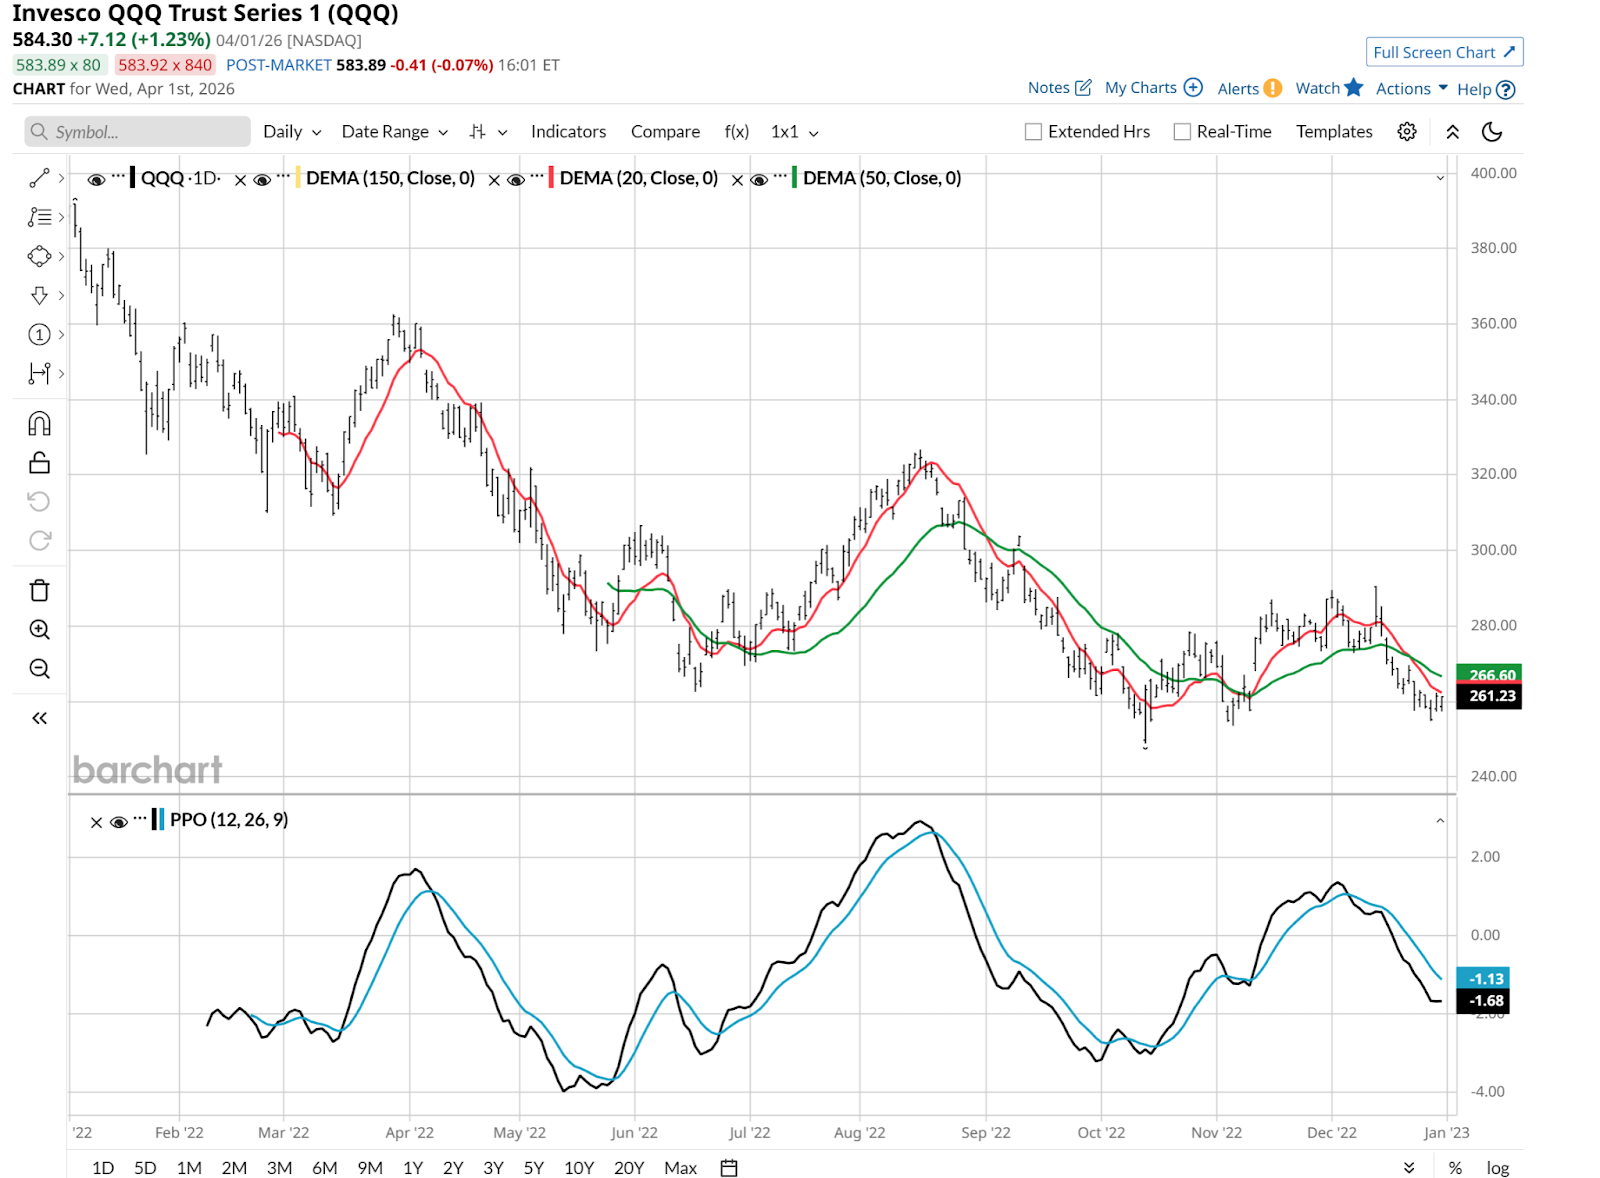
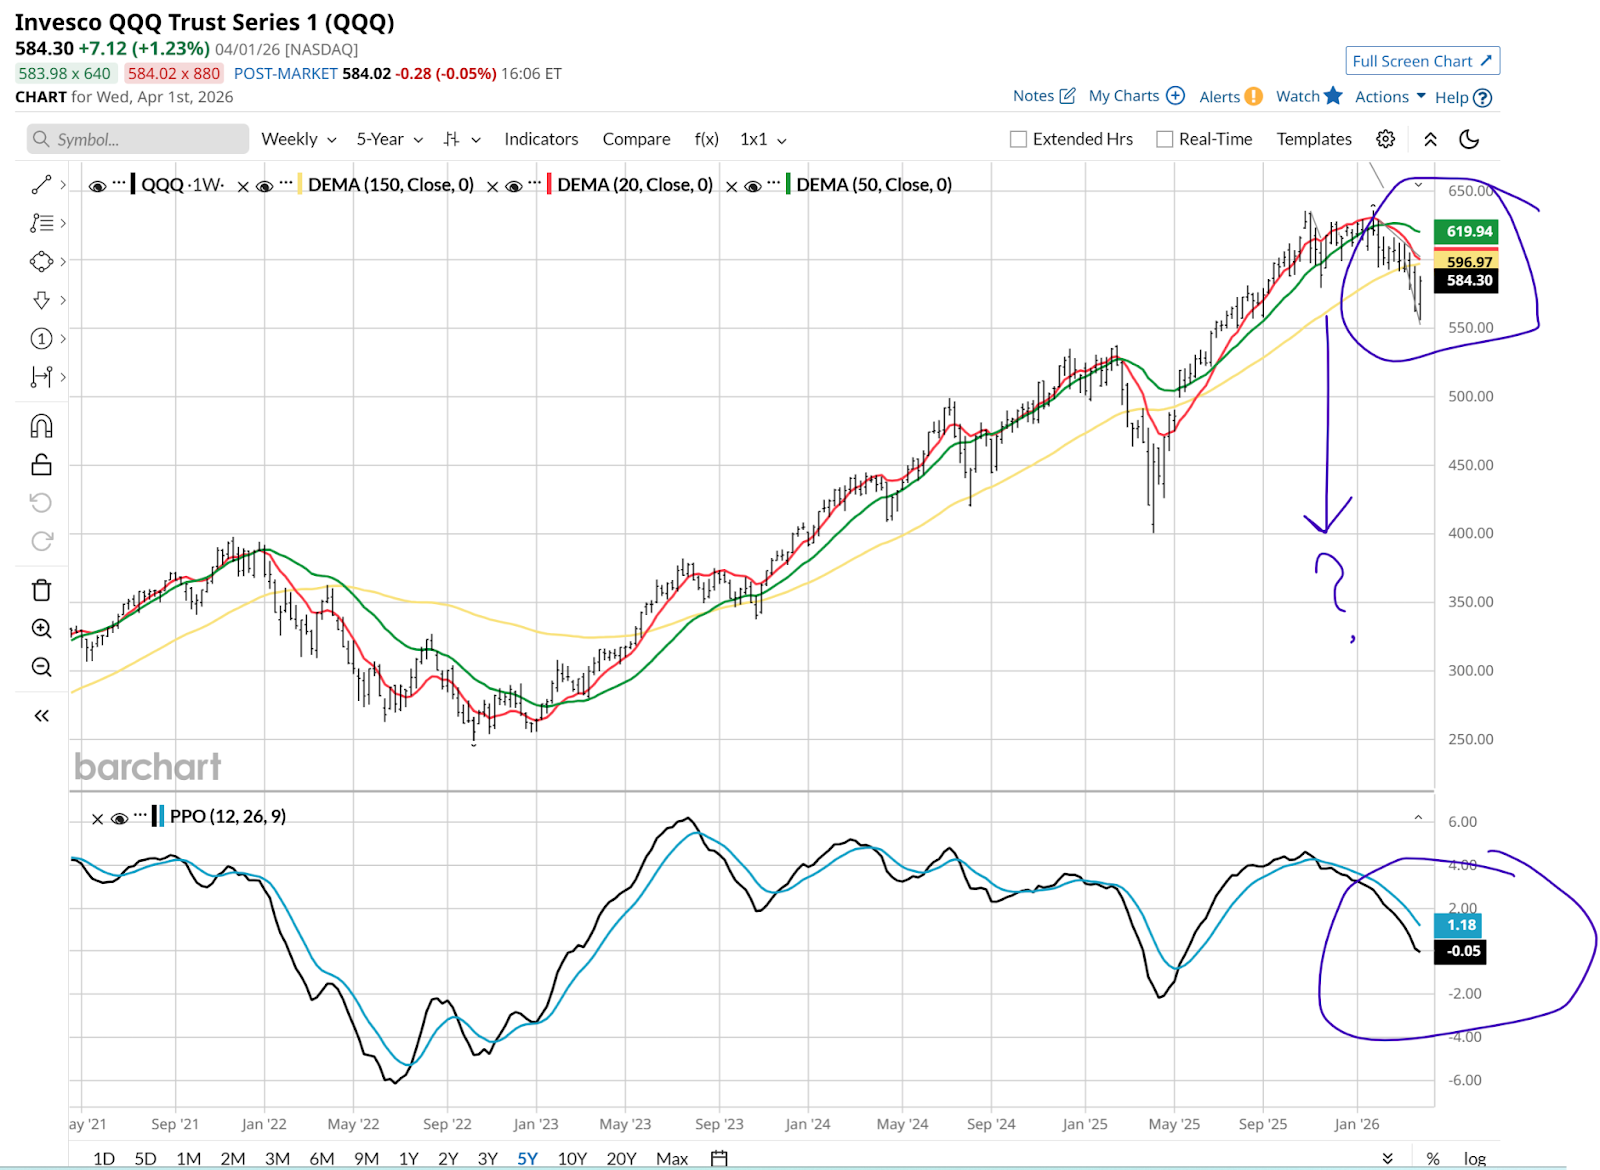
Here’s the current QQQ chart. It’s a weekly going back 5 years, and I ran that time frame so I could remove the short-term noise.
The Bottom Line
I can make two concluding points, other than the fact that I certainly benefitted from compiling this study. And I hope you did too.
1. QQQ appears to me to be in a VERY precarious position right now. The percentage price oscillator (PPO) is in negative territory, and while the recent pop gives it another life for now, if we break below the recent lows, I think investors should look out below.
2. I’ve marked a potential intermediate-term target. It is “only” at $400, a solid 30% below the current level. There is a lot of damage chart-wise, since as I’ve chronicled here since late last year, when the rollover in the 20-day moving average (not shown) spilled into the 20-week moving average (the red line in the chart above).
My ROAR Score has been a very good guide to QQQ’s ups and downs so far this year. It signalled average/neutral risk for much of the first quarter’s stagnation, before turning red (above average risk) just a week ago.
The concern with any technical system, be it ROAR, Barchart Opinion or any other, is whipsaw situations like the one we might be courting now. This is where if you're a risk manager first (like me), you don’t jump to do too much.
I will note that the current period more closely resembles any of the others since the start of 2020, because of the upward pressure on bond rates. If stagflation becomes the law of the land, so to speak, watch out. If the markets stop worrying about that, no problem. But in a frenetic geopolitical age like the current one, there are no leanings. Only educated guesses.
Rob Isbitts created the ROAR Score, based on his 40+ years of technical analysis experience. ROAR helps DIY investors manage risk and create their own portfolios. For Rob's written research, check out ETFYourself.com.
On the date of publication, Rob Isbitts did not have (either directly or indirectly) positions in any of the securities mentioned in this article. All information and data in this article is solely for informational purposes. For more information please view the Barchart Disclosure Policy here.
More news from Barchart