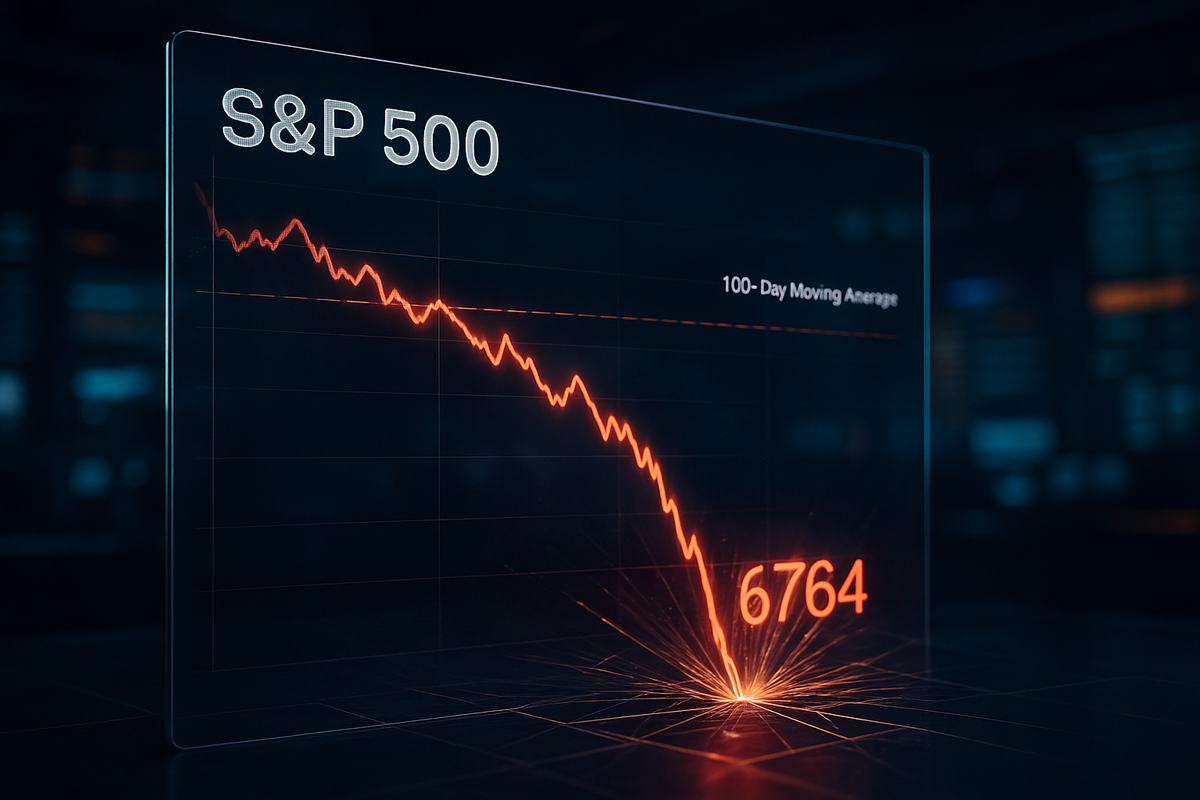
The long-standing resilience of the equity markets faced its most grueling test last week as the S&P 500 decisively broke through critical technical floors that had anchored the bull market for nearly a year. In a series of sessions that analysts are describing as a "regime shift," the index plummeted below its 100-day moving average and violated the crucial 6764–6775 support zone, signaling a definitive end to the "buy the dip" era that dominated 2025. By the closing bell on Friday, March 6, 2026, the index sat at its lowest level in months, leaving investors to grapple with a technical landscape that has turned decidedly bearish.
The implications of this breakdown are profound, as the breach of the 6764 "trapdoor" has effectively turned former support into a formidable ceiling of resistance. Unlike the sharp, panic-driven crashes of decades past, this decline has taken on a "slow-motion" quality, characterized by a persistent grind lower rather than a single-day capitulation. This methodical descent suggests a calculated institutional exit rather than retail panic, a trend that technical experts warn could see the index drift toward the 6500 psychological level before a true bottom is found.
The Technical Trapdoor: A Week of Market Erosion
The erosion of the market’s technical foundation began in earnest during the first week of March 2026. For months, the 100-day moving average (DMA), situated near the 6,830 level, had acted as an unbreakable floor for the SPDR S&P 500 ETF Trust (NYSEARCA: SPY). However, between March 2 and March 5, a "catalyst cocktail" of negative macroeconomic data—including a surprising contraction in manufacturing and a geopolitical escalation in the Middle East known as the "Iran Shock"—forced the index to gapping lower. By mid-week, the 100-DMA had been breached on heavy volume, stripping the market of its primary bullish momentum indicator.
The situation worsened on Friday, March 6, when the S&P 500 failed to hold the 6,764–6,775 support zone. This area represented a key consolidation low from mid-December 2025 and was viewed by many as the "line in the sand" for the current trend. When the index closed at 6,742, it confirmed a "trapdoor" event, effectively moving the market into a lower trading range for the first time in six months. The failure was underscored by a shocking February Non-Farm Payrolls report, which revealed a loss of 92,000 jobs, shattering expectations of growth and providing the fundamental weight necessary to break the technical support.
Market participants noted that the breakdown was not accompanied by the traditional spikes in the VIX (Volatility Index) usually seen during major pivots. Instead, the market experienced what traders call "distribution"—a period where large institutions quietly offload shares into any minor strength. This lack of immediate panic is precisely what has given the current trend its "slow-motion" feel; without a climactic sell-off to exhaust the bears, the path of least resistance has remained steadily downward.
Winners and Losers in the New Market Regime
As the headline index falters, a stark divergence has emerged between the previous leaders and a new class of defensive beneficiaries. The most visible casualties of this breakdown have been the "Magnificent Seven" and other high-weighting technology stocks. Microsoft Corp. (NASDAQ: MSFT) and Apple Inc. (NASDAQ: AAPL) have transitioned from market engines to heavy anchors. Microsoft, in particular, has struggled to maintain its 7,000-level leadership, and its inability to lead a recovery last week was cited by many as a primary reason for the S&P 500’s failure. Apple, meanwhile, has seen its stock stagnate as it pivots its brand focus toward sports and content, failing to provide the growth narrative investors currently crave during a period of rising interest rate fears.
Conversely, the energy sector has emerged as the primary "shelter from the storm." With the Strait of Hormuz conflict pushing crude oil prices toward $116 per barrel, companies like ExxonMobil Corp. (NYSE: XOM) and Chevron Corp. (NYSE: CVX) have decoupled from the broader market malaise. While the tech-heavy segments of the S&P 500 were bleeding value, energy-focused ETFs saw gains exceeding 20% in the last month. This rotation indicates that while the cap-weighted index is suffering, capital is not necessarily leaving the market entirely but is instead fleeing into "real-economy" assets that benefit from inflationary pressures and geopolitical instability.
The SPDR S&P 500 ETF Trust (NYSEARCA: SPY) itself is now facing what analysts call "concentration risk." With over 40% of its assets concentrated in the top ten holdings, the technical decay in names like Nvidia Corp. (NASDAQ: NVDA) and Microsoft has a disproportionate impact on the index. For investors holding broad-market index funds, the breakdown below the 100-DMA means that the "passive" gains of the last two years are now at significant risk, as the structural breadth of the market favors value and energy over the growth names that dominate the SPY.
Broader Significance and Historical Parallels
The current breakdown is more than just a technical glitch; it represents a significant shift in the broader financial landscape. The S&P 500's descent mirrors historical periods where rising energy costs combined with a cooling labor market to break long-term trends. Analysts have drawn comparisons to the market environment of the late 1970s and early 2000s, where "slow-grind" bear markets replaced the sharp, V-shaped recoveries that modern investors have become accustomed to. This "regime change" suggests that the low-volatility, high-growth environment of 2025 has been replaced by a period of stagflationary pressure.
Furthermore, the breakdown highlights the fragility of a market heavily reliant on a few trillion-dollar companies. The "concentration crisis" has reached a tipping point; when the leaders stop leading, the entire index structure begins to crumble. This has significant regulatory and policy implications, as the Federal Reserve may find itself in a "lose-lose" situation. With oil prices driving inflation higher and the jobs report showing economic cooling, the "Fed Put"—the idea that the central bank will step in to save the market—appears increasingly unavailable.
Historically, when the S&P 500 trades below its 100-day average during a period of rising commodity prices, a mean-reversion to the 200-day moving average is almost inevitable. The "slow-motion" nature of this trend is significant because it suggests that the market is repricing for a long-term shift in interest rate expectations rather than reacting to a one-time shock. This trend could lead to a sustained period of underperformance for passive indexing strategies, favoring active management and sector-specific rotation for the first time in nearly a decade.
The Path to 6500: What Lies Ahead
Looking forward, the immediate technical target for the S&P 500 is the 6500–6550 zone. This area is widely viewed as the necessary "flush" required to clear out the remaining bullish sentiment and reset the market's overbought conditions. Many research firms, including Wolfe Research, suggest that the index must test its 200-day moving average—currently hovering near 6,574—to establish a credible floor. Until the index can reclaim the 6775 level, any short-term rallies are likely to be viewed as "dead cat bounces" and opportunities for institutional distribution.
In the short term, investors should prepare for continued volatility as the market digests the "Iran Shock" and the possibility of further weakness in manufacturing data. Strategic pivots will be required; the previous strategy of blindly buying every dip in tech is currently a losing proposition. Instead, the focus is shifting toward "quality" and "defensive" positioning. Market opportunities may emerge in the form of oversold tech names, but only after a significant capitulation event that has yet to occur in this "slow-motion" decline.
The most likely scenario for the coming months is a period of "price discovery" where the market tests the 6500 level. If the 200-day moving average fails to hold, the conversation will shift from a "healthy correction" to a formal bear market. Investors should watch for a "VIX spike" above 30 as a potential sign of the panic necessary to mark a bottom; as long as the VIX remains in the low 20s while prices fall, the "slow-motion" grind lower is likely to continue.
Summary and Investor Outlook
The S&P 500's breach of the 100-day moving average and the 6764 support zone marks a pivotal moment in the 2026 market narrative. The transition from a momentum-driven bull market to a "slow-motion" technical breakdown has caught many investors off guard, especially those who had grown accustomed to the safety of large-cap tech. The primary takeaway is that the market's internal structure has weakened, and the "trapdoor" is now open for a deeper correction toward the 6500 level.
Moving forward, the market will likely be defined by a shift from growth to value and a heightened sensitivity to geopolitical and inflationary data. Investors should keep a close eye on the 200-day moving average and the performance of energy versus technology sectors. While the current trend is discouraging for passive indexers, it creates a target-rich environment for those who can navigate the rotation into the "real economy." The coming months will be a period of "waiting for the flush," as the S&P 500 seeks a firm foundation in a rapidly changing global economy.
This content is intended for informational purposes only and is not financial advice.