
Apple Inc. (AAPL) has experienced an uptick in its stock value, buoyed by positive market sentiment due to eased inflation. As the iPhone manufacturer heavily relies on discretionary consumer expenditure, decreased inflation spurs consumer purchasing power, working in its favor.
However, Apple witnessed a consistent decrease in overall sales for the fourth consecutive quarter during their fiscal fourth-quarter earnings release, despite surpassing analyst expectations in sales and earnings per share. There have been notable declines year-over-year across all product segments except for iPhone, with iPad and Mac experiencing the most significant drops.
AAPL's revenue was $89.50 billion, slightly higher than the forecasted $89.37 billion, and its EPS of $1.46 exceeded the consensus estimate by 4.8%. Yet, quarterly revenue saw a slight contraction of less than 1% during the September quarter. The tech titan reported annual sales of $383.29 billion, marking a 2.8% fall from the previous year.
Although Apple didn’t give formal guidance, executives suggested the company may not return to growth in the important holiday quarter.
This year presented its fair share of challenges for the company, due to broad economic pressures impacting consumer spending and leading to repeated drop-offs in product sales.
Given the uncertain outlook for the December quarter, I would advise adopting a more cautious approach towards investing in the stock and wait for an optimal entry point. Let’s discuss some key financial indicators to glean a deeper understanding of the current scenario.
Exploring Apple Inc.'s Financial Trends and Performance from 2020 to 2023
The data presents the trailing-12-month Net Income for AAPL from December 26, 2020, to September 30, 2023. A clear trend of climbing income is noticeable during the initial period up until March 26, 2022, where the Net Income reached a peak of $101.94 billion. However, after this peak, an irregular fluctuation pattern is observed with a declining trend. Key Highlights:
- In December 2020, AAPL reported a Net Income of $63.93 billion.
- There was continuous growth up until March 27, 2021, with Net Income posting $76.31 billion, proceeding towards a growing trend over consecutive quarters.
- The reported Net Income peaked to $101.94 billion by March 26, 2022.
- A declining pattern started post-March 2022 reaching $99.63 billion and $99.80 billion in June and September 2022 respectively.
- By December 31, 2022, Net Income further dipped to $95.17 billion marking a significant drop.
- During 2023, despite minor fluctuations, the overall trend remained consistently below $100 billion with Net Income figures hovering just over the mid $90 billion range.
- The last available data point from September 30, 2023, shows the Net Income stabilising slightly higher at $96.99 billion compared to earlier periods in the year.
The calculated growth rate, measured from the first value in December 2020 to the last value in September 2023, indicates a growth of approximately 51.51%. Despite the overall growth observed during this period, special attention should be given to the more recent diminishing trend from March 2022 onwards. This could yield important outcomes for the future financial trajectory of AAPL.
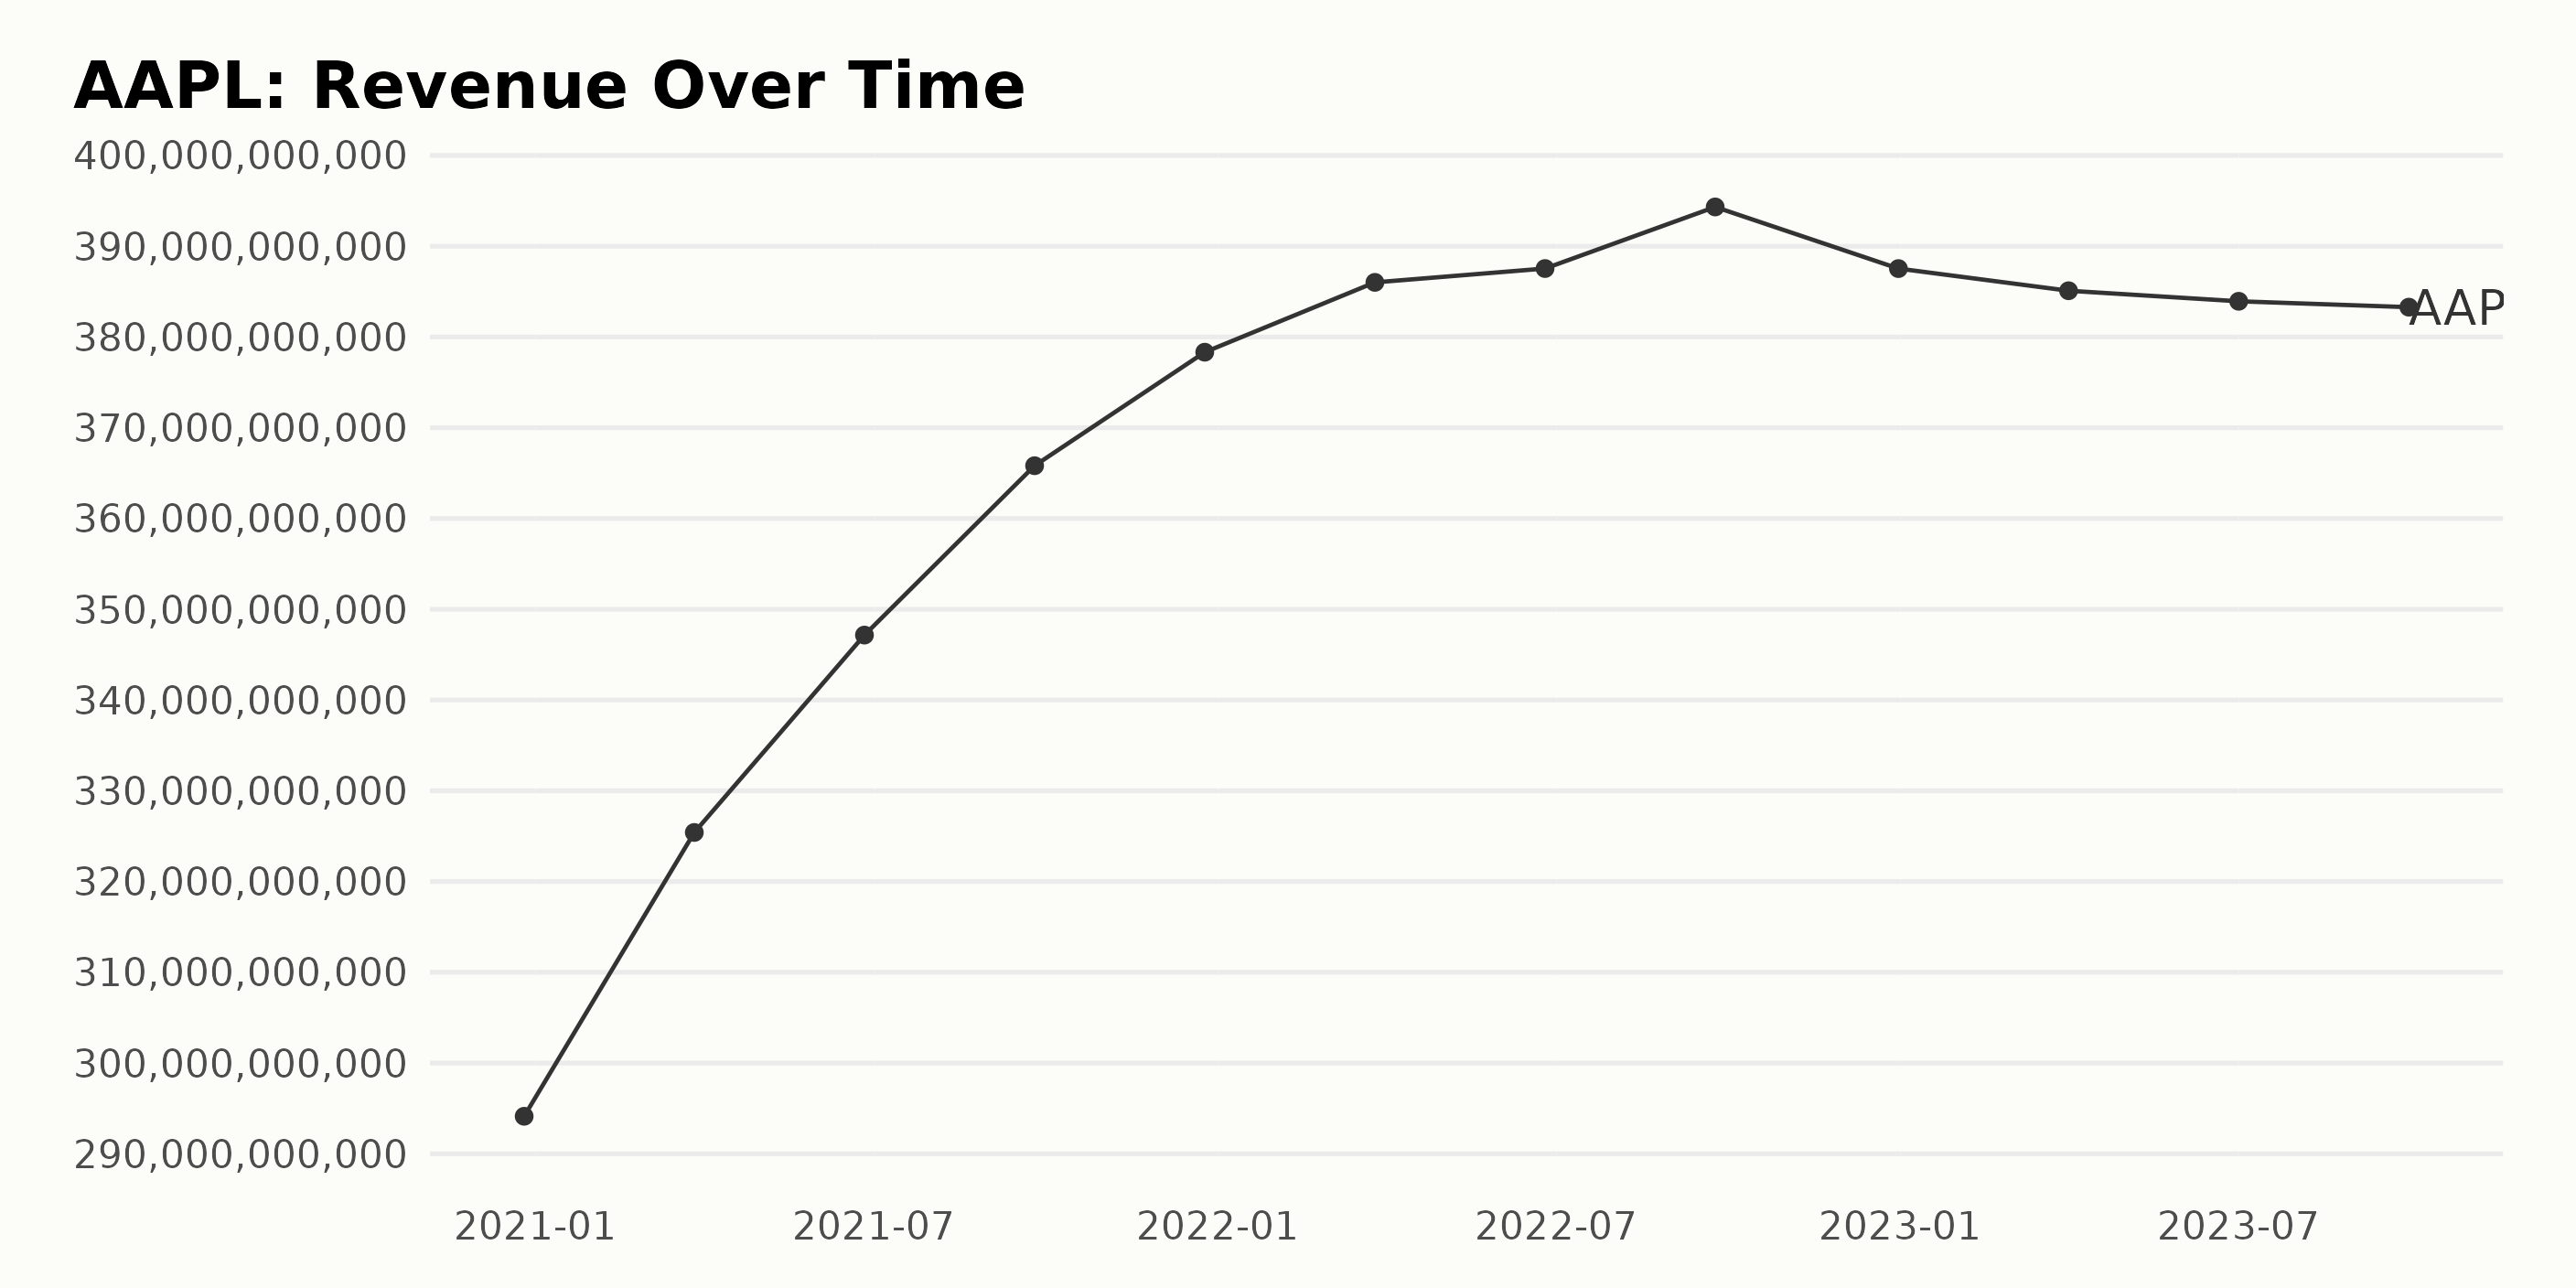
The trailing-12-month revenue of AAPL has displayed a fluctuating trend over the recent years, according to the data series.
- On December 26, 2020, the company reported Revenue of $294.14 billion.
- There was substantial growth in Revenues over the next few quarters, reaching $347.16 billion by June 26, 2021, and $365.82 billion by September 25, 2021.
- This upward trend continued, culminating in a Revenue of $387.54 billion as of June 25, 2022.
- The highest recorded Revenue in this series is $394.33 billion on September 24, 2022.
- However, a slight downward trend materialized afterwards, with the Revenue dropping to $387.54 billion by December 31, 2022.
- This decline continued into the following year, with the Revenue further decreasing to $385.10 billion by April 1, 2023, $383.93 billion by July 1, 2023, and $383.29 billion as of the last report on September 30, 2023.
Calculating the growth rate from the first value to the last reveals an approximate 30.3% increase in Revenue despite recent fluctuations. Please note that the trend might change based on various factors, such as market dynamics and company performance.
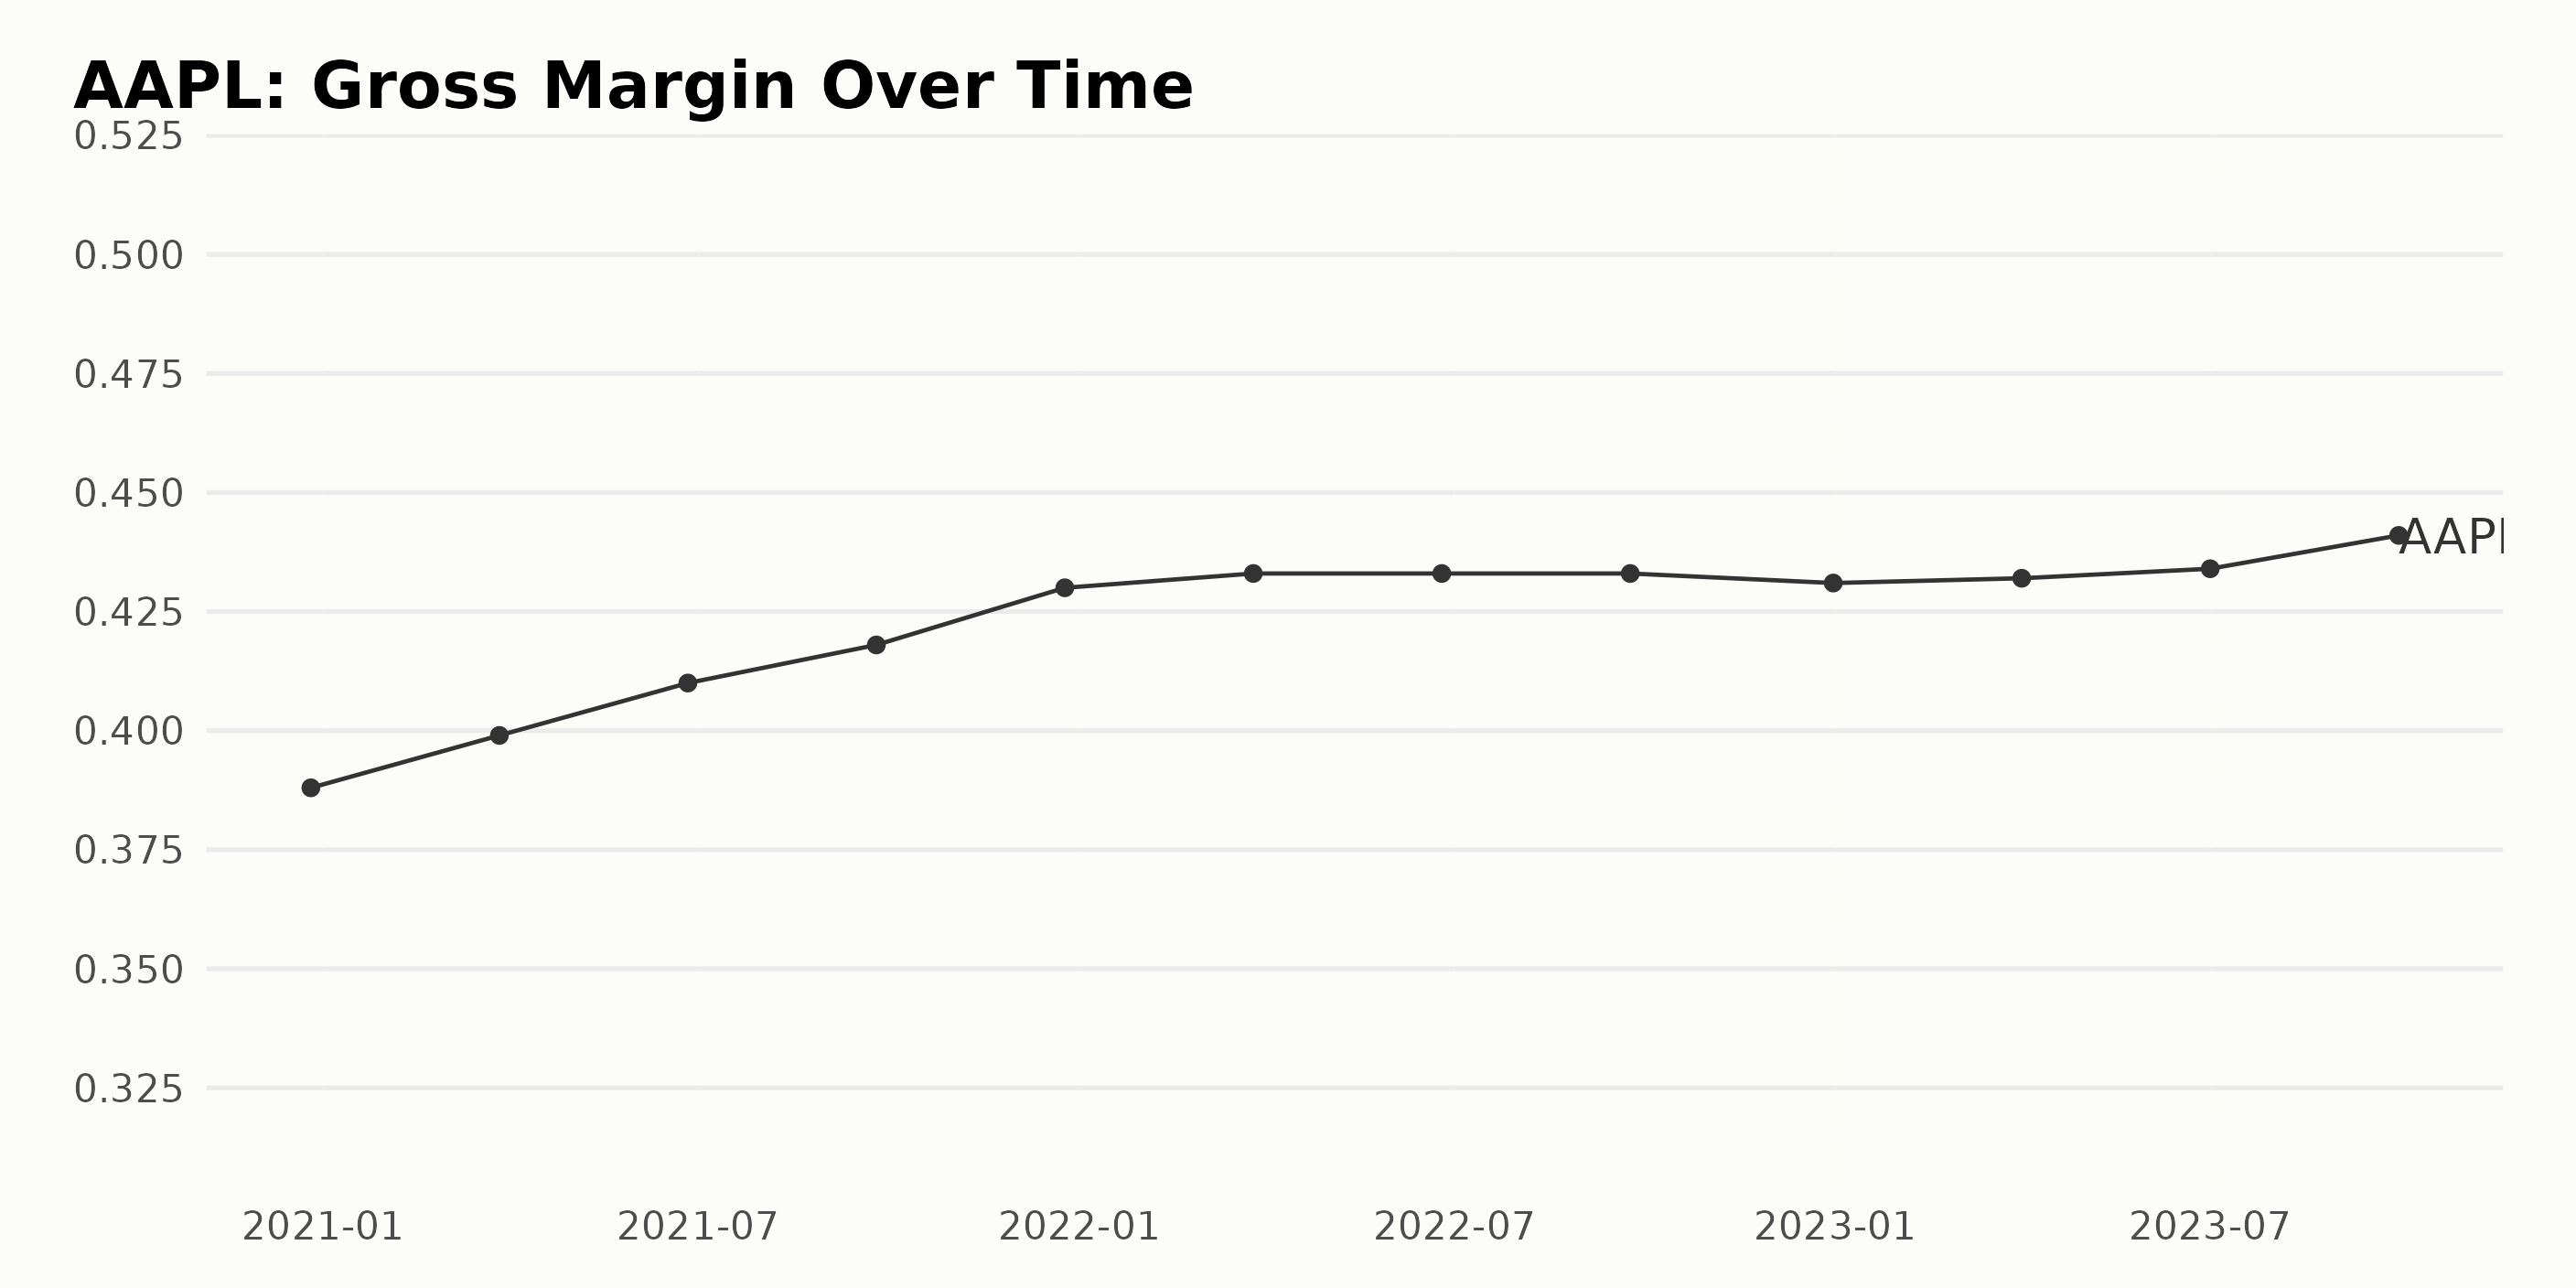
The Gross Margin of AAPL has displayed a general upward trend with moderate fluctuation over the period observed. Here is a summary of the growth pattern:
- On December 26, 2020, the Gross Margin was 38.8%.
- This value saw a consistent increase, reaching 41.8% on September 25, 2021.
- We observed some stability in the Gross Margin over the next year as it maintained a close around 43.3% from March 26, 2022, to September 24, 2022.
- A slight sway emerged towards year-end, with the Gross Margin falling slightly to 43.1% on December 31, 2022, before climbing to 43.2% on April 1, 2023.
- The most recent data shows a resurgence of growth with the Gross Margin reaching its highest point of 44.1% on September 30, 2023.
Calculating the change from the first value to the last value, there has been an overall increase of approximately 5.3%. This growth suggests an improvement in profitability for AAPL over this period. It's important to note that these numbers emphasize a steadfast improvement in Gross Margin, despite slight fluctuations experienced through this timeline.
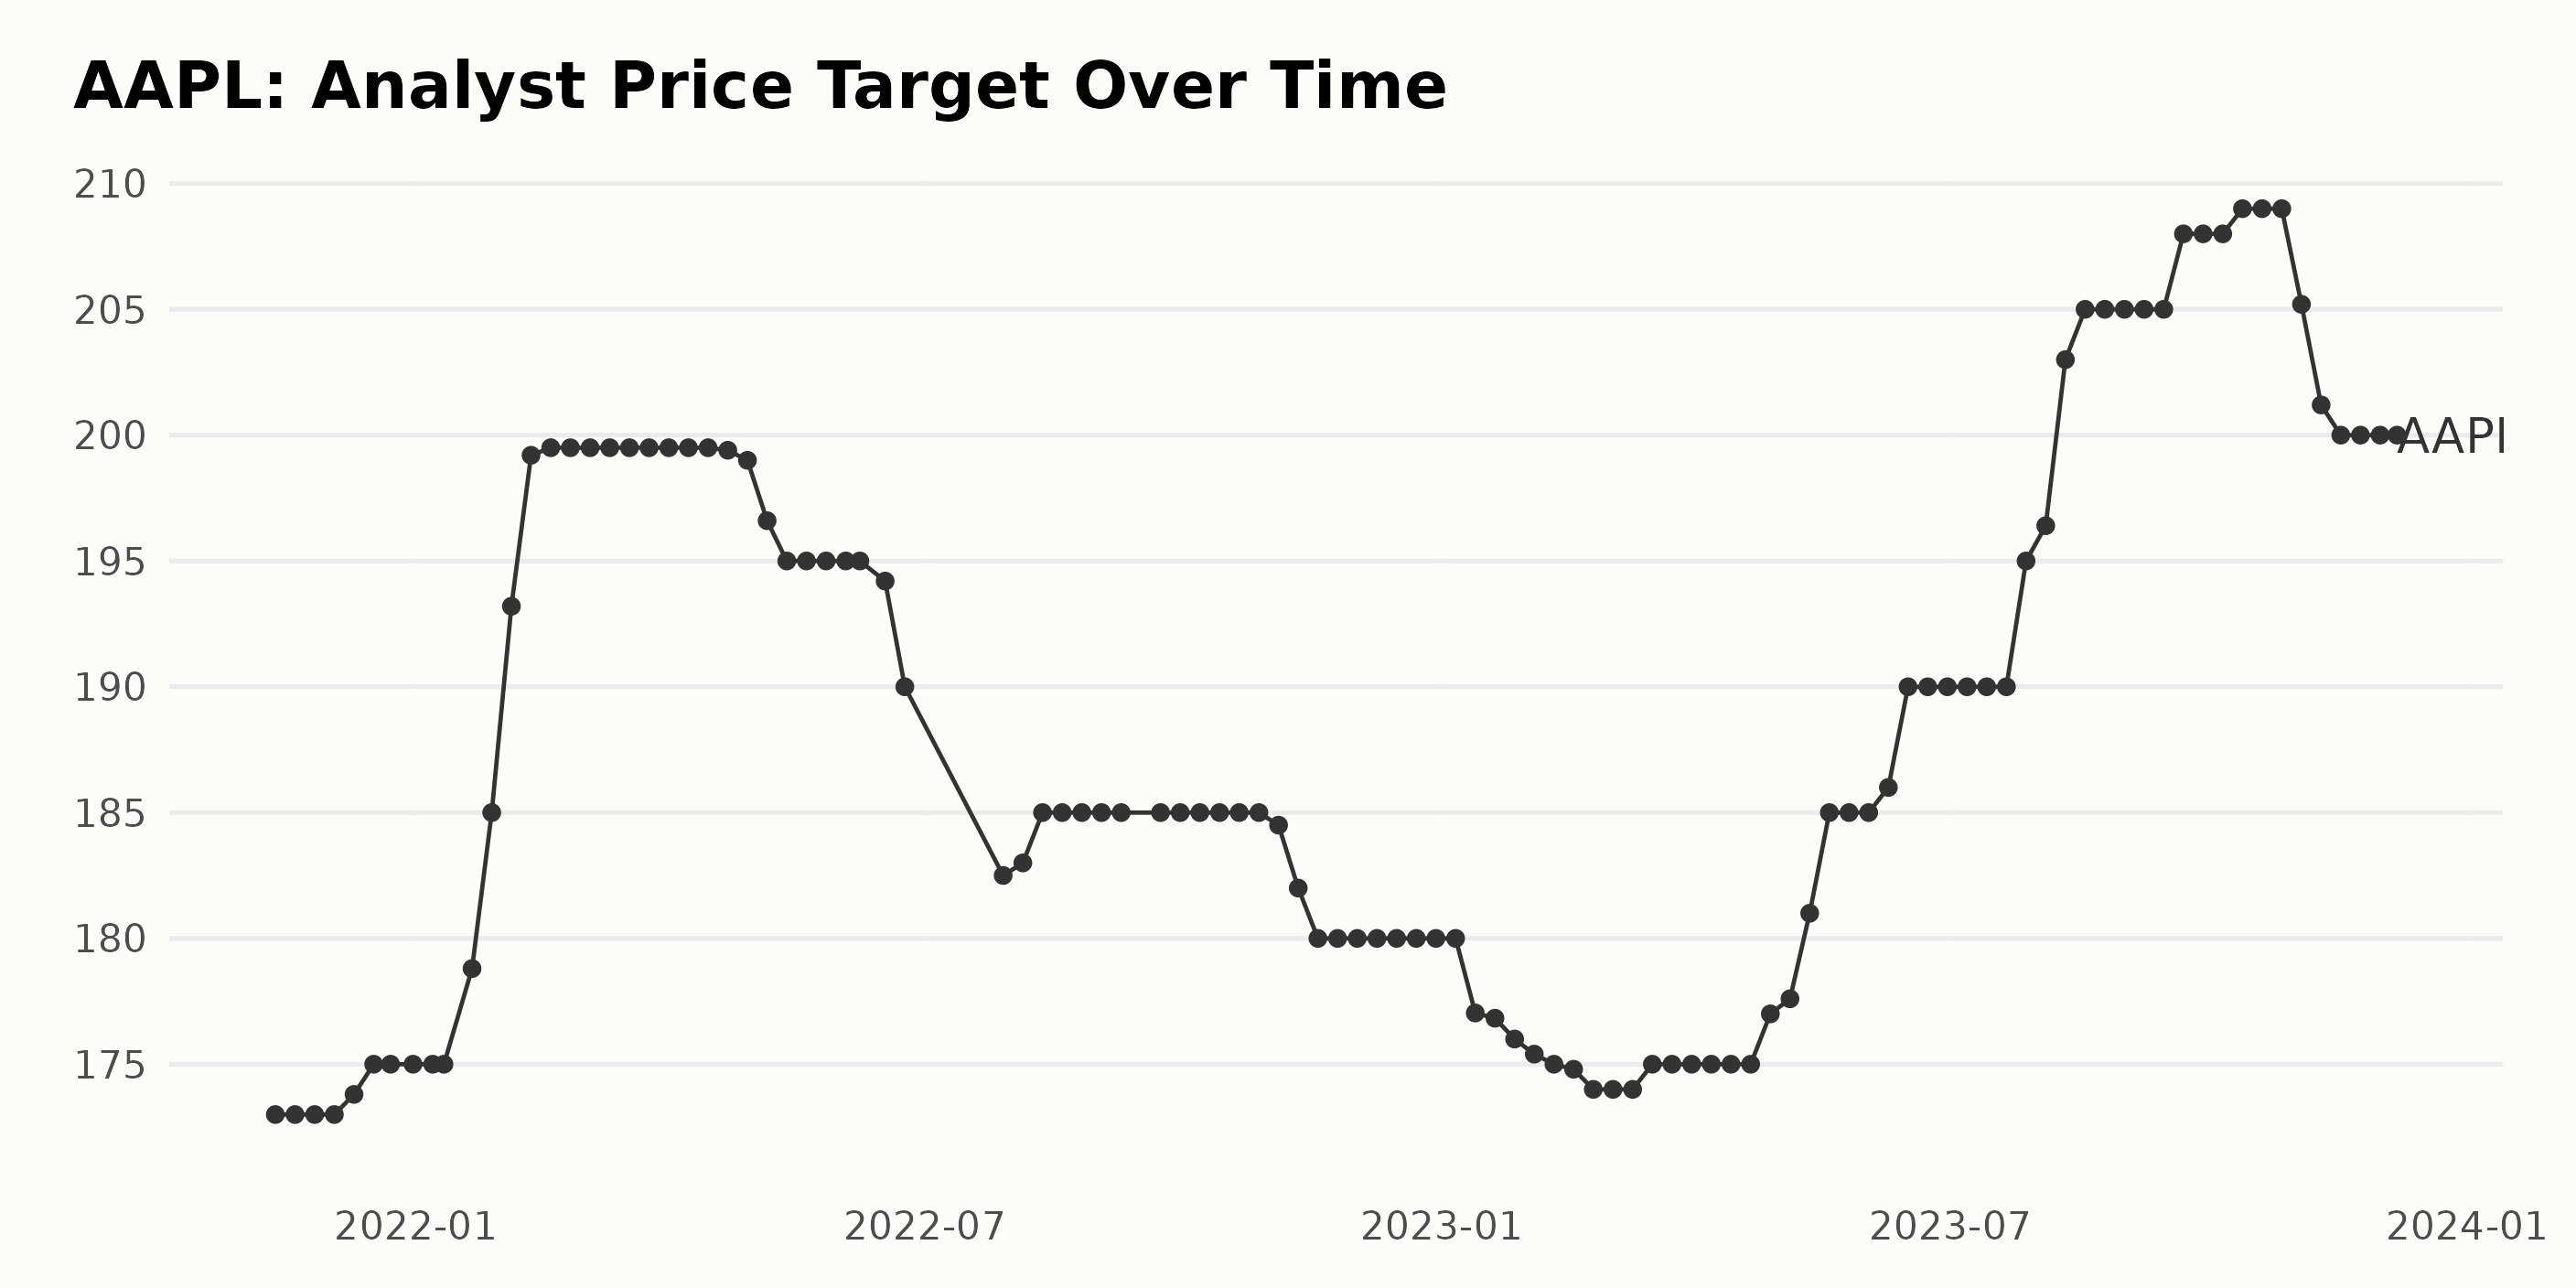
The Analyst Price Target for AAPL displays both a trend and some fluctuations over the given period:
- In November 2021, the Analyst Price Target started at $173 and then slightly increased to $175 by December of the same year.
- There was a significant jump in January 2022, reaching a peak of $199.5 by February and holding steady at this value until April 2022.
- Subsequently, there was a slow but continuous decline until June 2022 with a sudden drop to $182.5 by July 2022.
- The price steadily increased, although at a slower pace than previously, and remained stationary around $185 from August to October 2022.
- Slight decreases occurred during November 2022, finally settling at $180 by the end of December 2022.
- Resuming in 2023, the price started decreasing further reaching $174 by early March. Following March, the price had slight movements without any drastic changes until end July, where it rose to $195.
- Starting August 2023, a substantial growth was seen reaching a new peak of $208 by September. This was followed by a decline in late October.
- Presently, the target stands at around $200 in December 2023.
The growth rate from November 2021 to December 2023 calculates to around 15.6%. Towards the end of the time series, the trend seems to be slightly downward, but the overall pattern is one of growth when we compare the last value to the first.
Analyzing Apple Inc.'s Share Price Fluctuations: A Tale of Instability in H2 2023
Upon analyzing the data from June to December 2023, it is evident that the share price of AAPL fluctuated during this period.
- The share prices increased initially from $184.15 on June 16, 2023, to $191.62 on July 7, 2023.
- However, Apple Inc. saw a decrease in its shares' value in mid-July, from $191.62 to $189.43 by July 14, 2023.
- A brief upward trend was witnessed as the share value increased again, reaching $194.41 by July 28, 2023.
- The sharpest decrease occurred in August, with prices dropping from $192.07 on August 4 to a significant low of $176.57 by August 18, 2023.
- After a slight recovery in early September ($185.41 on Sep 1, 2023), the prices began falling again, hitting a low of $172.16 by the end of September.
- The share prices picked up once more in November, peaking at $190.83 on November 24, 2023.
- No major changes were observed in December, with prices hovering just above $190.
In terms of growth rate, the company's share price experienced some instability during this period. After an initial rise, there was a notable decrease followed by fluctuating periods of increasing and decreasing trends. Overall, the clear trend during this period seems to be one of deceleration, especially after the peak of July 2023. The company did recover towards the end of the year but remained below the highest point reached earlier. Here is a chart of AAPL's price over the past 180 days.

Exploring Apple's Key POWR Ratings Dimensions: Quality, Stability, and Sentiment (June-December 2023)
AAPL has an overall C rating, translating to a Neutral in our POWR Ratings system. It is ranked #23 out of the 37 stocks in the Technology - Hardware category.
The three most noteworthy dimensions for AAPL according to the POWR Ratings from June to December 2023, are Quality, Stability and Sentiment.
Quality: This dimension consistently achieves the highest rating over the time span. Notably, in November 2023, the Quality score increased slightly to 98, from 97 for all previous months. This suggests that Apple's overall operation quality and financial health continue to stay robust and even improve towards the end of the year.
- June 2023: 97
- July 2023: 97
- August 2023: 97
- September 2023: 97
- October 2023: 97
- November 2023: 98
- December 2023: 98
Stability: Interesting to note, the Stability rating showcased a slight upward trend initially from 62 in June 2023, to peak at 68 in August 2023, before seeing a small decline towards the end of 2023. It appears that the stability of Apple faced a minor fluctuation during this period.
- June 2023: 62
- July 2023: 63
- August 2023: 68
- September 2023: 65
- October 2023: 63
- November 2023: 62
- December 2023: 65
Sentiment: The Sentiment dimension displayed the most variance across the period, with ratings going as high as 75 in August 2023, and then declining to 57 by December 2023. This indicates fluctuating dynamics regarding Apple's popularity or sentiment among investors within that year.
- June 2023: 61
- July 2023: 61
- August 2023: 75
- September 2023: 68
- October 2023: 57
- November 2023: 63
- December 2023: 57
How does Apple Inc. (AAPL) Stack Up Against its Peers?
Other stocks in the Technology - Hardware sector that may be worth considering are VTech Holdings Limited (VTKLY), Panasonic Holdings Corp. (PCRFY), and Daktronics Inc. (DAKT) -- they have better POWR Ratings.
What To Do Next?
Discover 10 widely held stocks that our proprietary model shows have tremendous downside potential. Please make sure none of these “death trap” stocks are lurking in your portfolio:
AAPL shares were trading at $194.22 per share on Thursday afternoon, up $1.90 (+0.99%). Year-to-date, AAPL has gained 50.32%, versus a 21.16% rise in the benchmark S&P 500 index during the same period.
About the Author: Subhasree Kar

Subhasree’s keen interest in financial instruments led her to pursue a career as an investment analyst. After earning a Master’s degree in Economics, she gained knowledge of equity research and portfolio management at Finlatics.
The post Is Apple (AAPL) Giving Buy or Sell Signals for December? appeared first on StockNews.com
