
The Electric Vehicle (EV) industry’s powerhouse, Tesla, Inc. (TSLA), recently held a first-delivery event to launch its Cybertruck. However, according to a survey conducted by the Canaccord Genuity team, 67% of respondents answered "no" as to whether they would buy the Cybertruck after the company revealed pricing and truck specifications.
On top of it, TSLA is facing a sales slowdown in its China-made EV sales. The China Passenger Car Association (CPCA) reported that the company’s sales of China-made EVs dropped 17.8% year-over-year to 82,432 cars in November. TSLA is also facing issues in Scandinavia regarding collective employee bargaining rights.
Given this backdrop, let’s look at the trends of TSLA’s key financial metrics to understand why it could be prudent to avoid the stock now.
Analyzing Tesla, Inc. Financial Figures: A Journey from December 2020 to September 2023
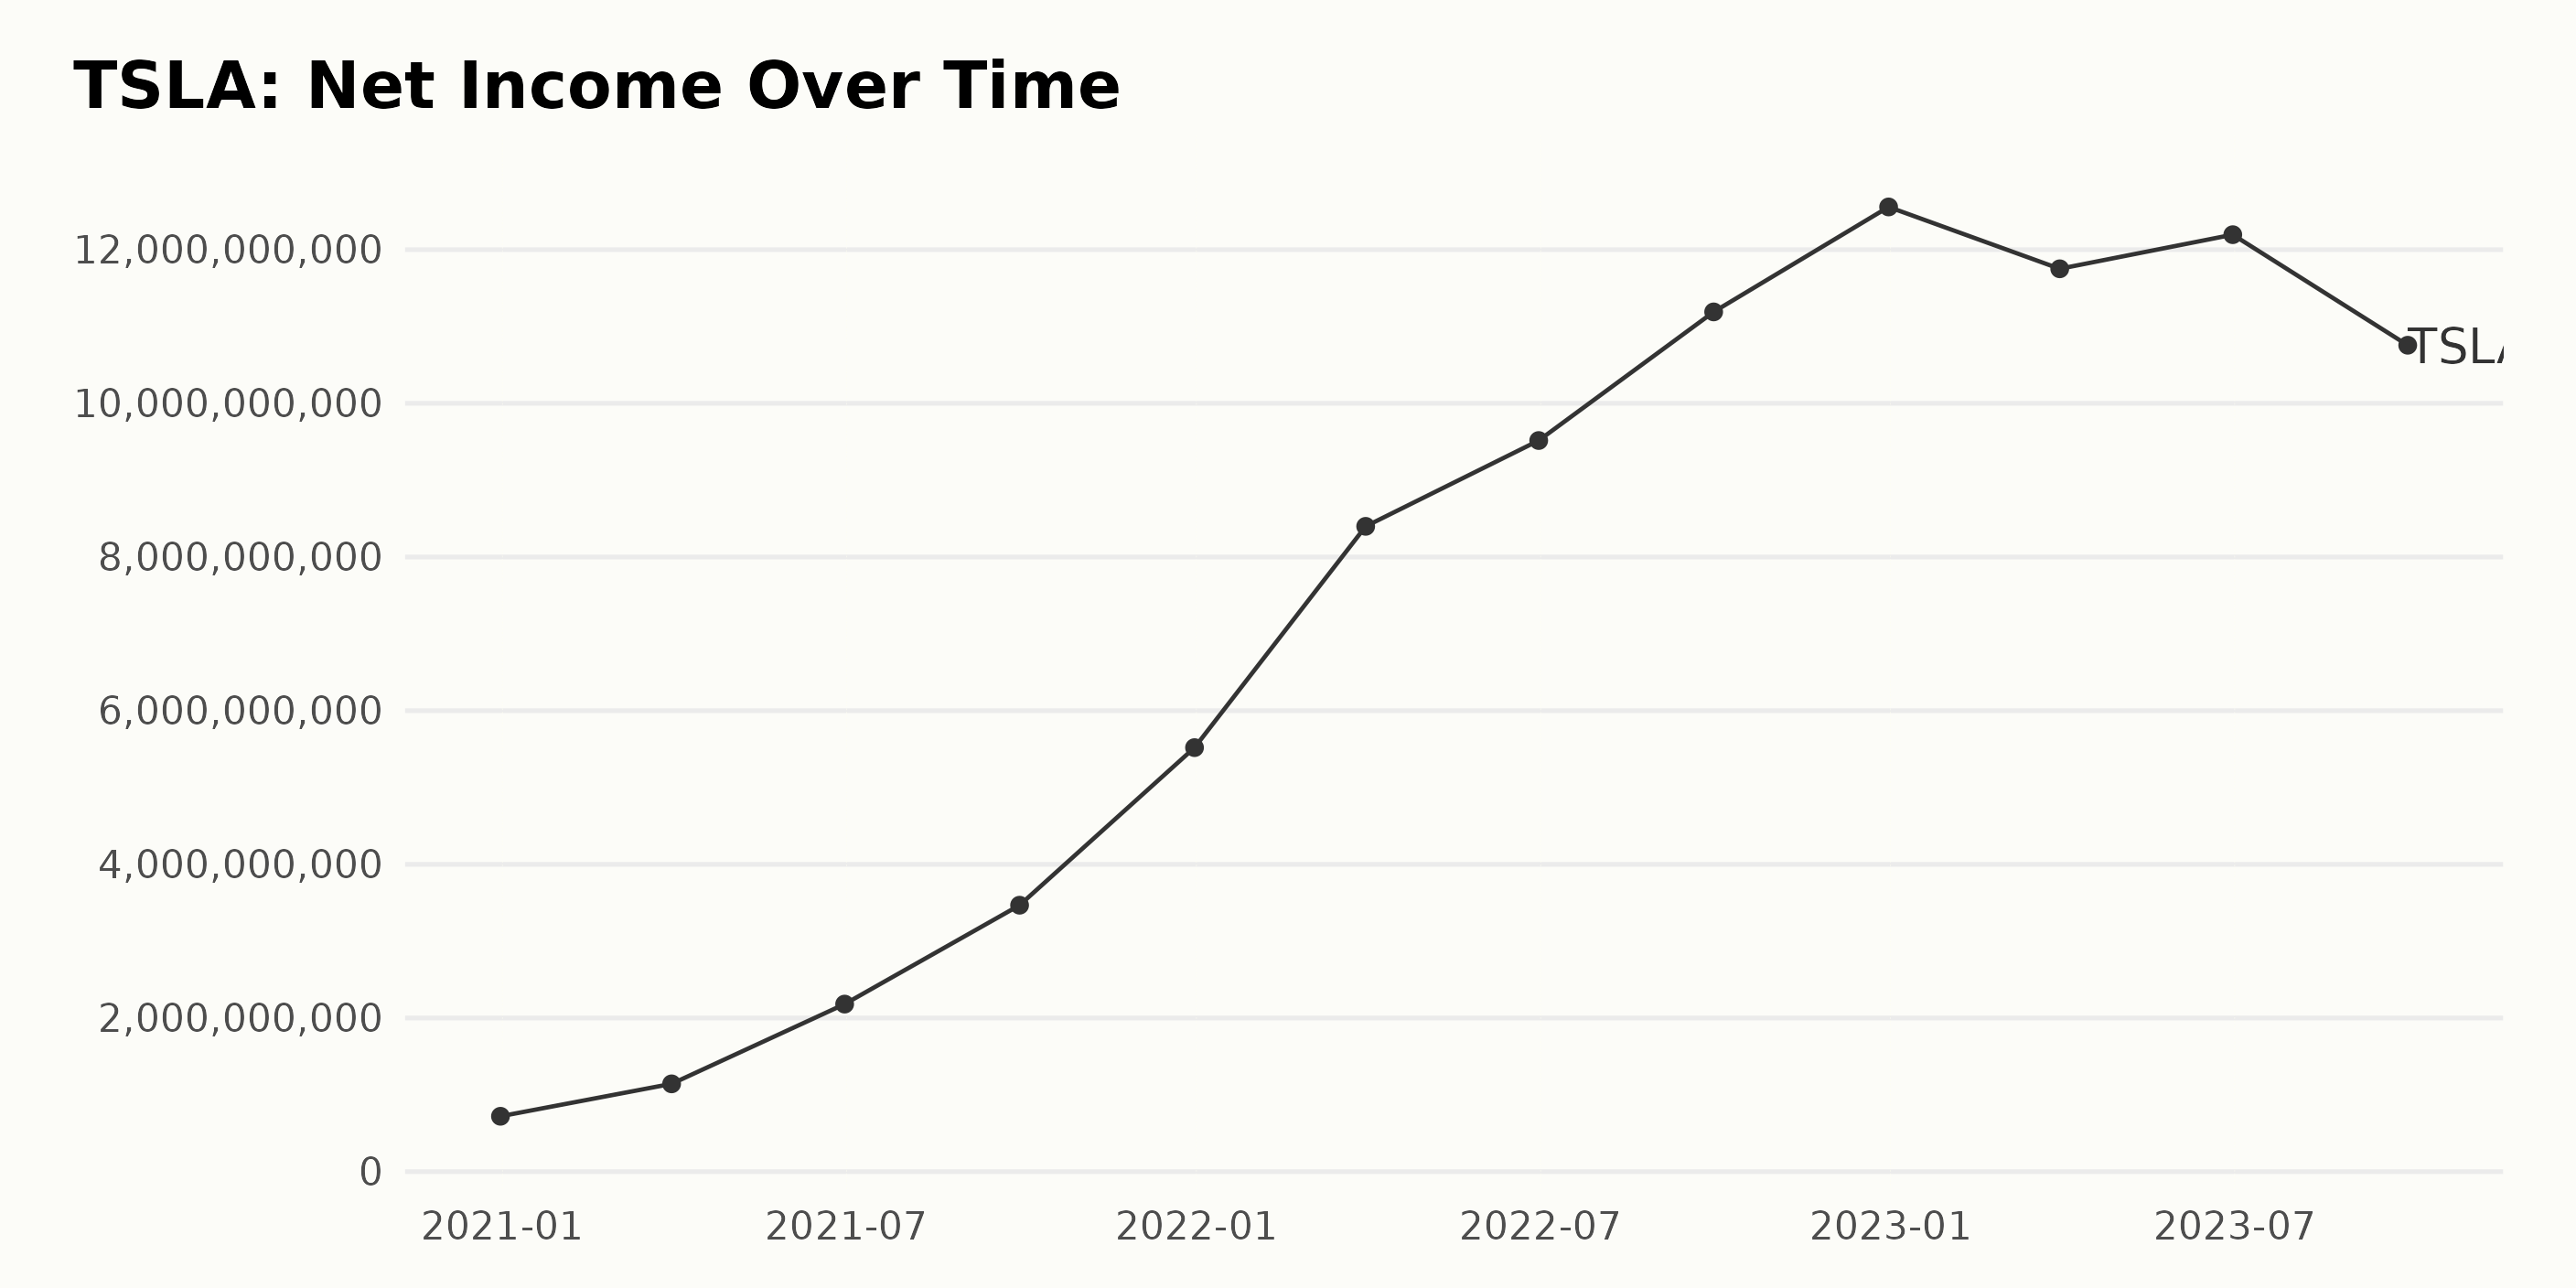
The provided data outlines the progression of TSLA's trailing-12-month net income over the period from December 2020 to September 2023. A general summary and analysis of these figures are as follows:
- As of December 31, 2020, TSLA reported a net income of $721 million.
- We can see a consistent increasing trend in TSLA's net income during this period. There has been significant growth in every quarter and substantial improvements yearly.
- By March 31, 2021, the net income rose to $1.14 billion, followed by a more sizable increase to $2.18 billion on June 30, 2021.
- The improvement continued substantially, with the net income hitting unprecedented heights going into 2022. By December 31, 2022, the net income was $12.56 billion.
- However, in the first quarter of 2023, there was a slight decline to $11.75 billion, suggesting minor fluctuations despite the overall upward trajectory.
- Despite this, the net income recuperated to $12.19 billion by June 30, 2023, but slipped again to $10.76 billion by the end of September of the same year.
Key Highlights:
- Overall, TSLA demonstrated significant growth in its net income over the given period. The trend is generally ascending.
- The growth from the starting value ($721 million in December 2020) to the final value ($10.76 billion in September 2023) indicates a stark contrast and suggests an impressive upward trajectory.
- There were smaller fluctuations in the latter part of the series (2023), where the net income decreased, bucking the dominant upward trend, marking these periods as distinctive within the overall trend.
The data underlines the growth of TSLA's profitability during this time, with a consistently rising trend seen in the net income, notwithstanding occasional downturns. It underscores TSLA's remarkable financial progress over the period in view.
The trend and fluctuations in the gross margin of TSLA highlight a dynamic scenario over the observed interval, with an emphasis on recent data and concluding trends. In the following, we outline the significant markers and growth rate calculated from the first to the last value.
- It commenced with a gross margin of 21.00% on December 31, 2020.
- A gradual increase was visible in succeeding periods, reaching its peak at 27.10% on both March 31, 2022, and June 30, 2022.
- Followed by a slight drop to 26.60% in September 2022 and a more significant fall to 25.60% on its last record in December 2022.
- More recent data from 2023 shows a continued reduction in gross margin, down to 23.10% in March, 21.50% in June, and 19.80% in September.
Drawing attention to the growth rate from December 31, 2020, to September 30, 2023, there is an evident decrease in the gross margin from 21.00% to 19.80%.
Consequently, this marks a negative growth rate of 5.70%, signaling caution for investors and correlating to an increasingly cost-intensive operation for TSLA. Fluctuations in margins may reflect the company's strategic decisions and economic conditions, which require further exploratory and contextual analysis.

The series of data you provided reflects TSLA's Return on Invested Capital (ROIC) spanning from December 31, 2020, to September 30, 2023. Here's an overview of the identified trends and fluctuations:
- From December 2020 to December 2022, TSLA’s ROIC demonstrated an upward trend with some fluctuations. The ROIC grew from a meager 0.058 on December 31, 2020, to a robust 0.399 by December 31, 2022. This marks a noteworthy increase of over 587% across two years.
- While the general growth trajectory was positive, non-linear advancement was observed throughout these years. Minor but noticeable drops were reported between quarters, such as the decline from 0.309 in March 2022 to 0.344 in June 2022.
- The highest ROIC value of 0.399 was observed at the close of 2022. Following this peak, there was a marked downturn in the first three quarters of 2023. By the end of September 2023, the ROIC settled at 0.247, marking a substantial reduction from its high point.
Overall, TSLA's ROIC exhibited significant expansion followed by a downward correction in recent times. Further data is required to ascertain if this reduction trend will continue or bounce back.

The data represents the Return on Sales (ROS) of TSLA over a period from December 31, 2020, to September 30, 2023.
- A clear upward trend in TSLA's ROS is noticeable through the year 2022, followed by a declining trend in 2023.
- On December 31, 2020, Tesla's ROS was 5.6%. This figure progressively increased up to 17% on December 31, 2022, showing a significant growth rate.
- However, post-2022, starting from March 31, 2023 (with a ROS of 15.1%), there was a noticeable decrease reflected in the numbers leading up to September 30, 2023, where it records a ROS of 12.4%.
- In the final few quarters from March 2022 to September 2023, although mostly on a decline, ROS figures fluctuated slightly. For instance, the value reached a peak of 17% on December 31, 2022, before reducing to 15.1% on March 31, 2023, then marginally increasing to 16.8% on June 30, 2023, and eventually dropping to 12.4% by the end of September 2023.
Overall, the sequence displays an increasing trend in the ROS for TSLA over the years up until 2022, after which a slight reduction and fluctuation in the values are observed into 2023.

Unpacking Tesla's Volatile Share Price Trends: June to December 2023
The data shows the share price trends of TSLA from June to December 2023. Here are the key observations from the data:
- On June 9, 2023, the TSLA share price was $247.16.
- The share price showed an increasing trend throughout June, reaching a peak of $262.73 on June 23, 2023.
- In early July, the price increased rapidly, hitting a high of $280.82 on July 21, 2023.
- However, after that, from late July through August, the share price saw a steady decline, falling to its lowest point at $228.08 on August 18, 2023.
- Except for a brief resurgence in early September, when the stock price nearly hit $272.15, the trend between August and October was predominantly bearish, dropping to $212.43 on October 27, 2023.
- In November, the prices began increasing again, hitting $233.45 on November 17, 2023, and continuing onto a month-end high of $236.56 on November 24, 2023. Lucky investors who got in at or near the October low would have seen a nice gain by the end of November.
- By December 5, 2023, the stock price was $238.72, suggesting a slow but stable increase since the latter part of November.
Summarizing the growth rates, the price trend has been relatively volatile. There were periods of growth and decline, but no clear accelerating or decelerating trend occurred within this time period. The general trend suggests possible cyclical periods of growth and contraction.
However, each cycle seems to start and end at lower prices, hinting at a long-term bearish trend between June and December 2023. Here is a chart of TSLA's price over the past 180 days.

Assessing Tesla's Market Performance: A Dive into Quality, Momentum, and Growth
TSLA is a stock in the Auto & Vehicle Manufacturers category, which consists of a total of 49 stocks. The POWR Ratings grade and its ranking within this category have been changing over the course of 2023. Here are some notable points:
- In June 2023, TSLA had a POWR grade of C (Neutral), with its rank within the category varying between #40 and #39.
- For most part of July 2023 to October 2023, the POWR Grade remained C (Neutral). Its rank oscillated around #38 and #39 in the category.
- However, towards the end of October 2023, the POWR grade dropped to D (Sell). During this period, it was ranked #40 in the category.
- In November and the early part of December 2023, TSLA maintained its POWR grade of D (Sell) and improved its rank to #39.
As of the latest data available on December 6, 2023, TSLA continues to have a POWR grade of D (Sell) and ranks #39 within the Auto & Vehicle Manufacturers category.
Based on the POWR Ratings analysis for TSLA's three most noteworthy dimensions are Quality, Momentum, and Growth.
Quality:
The shared data indicates that TSLA consistently scored the highest in the Quality dimension throughout the monitored timeframe:
- In June 2023, the Quality score was 93.
- The score marginally decreased in subsequent months - 93 in July, 91 in August, 90 in September, 89 in October, and 86 in November.
- By December 5, 2023, the Quality score showed a surprising uptick to 87, contradicting the continuous decline trend.
Momentum:
TSLA's Momentum scores reveal a downward trend:
- The Momentum score started at 73 in June 2023.
- Declines were noted over the subsequent months - 67 in July, 57 in August, 52 in September, and 48 in October, before dipping to 27 in November.
- As of December 5, 2023, the Momentum score is 25, concluding the monitored period at its lowest point.
Growth:
TSLA's Growth ratings also showcase a clear downward trend:
- The initial Growth score in June 2023 stood at 55.
- This score remained consistent in July but then started decreasing in the following months - 40 in August, 36 in September, 27 in October, and drastically declining to 12 in November.
- By December 5, 2023, the Growth score had fallen further to 10, suggesting a significantly declining growth rate for Tesla during the period.
These trends and scores in Quality, Momentum, and Growth are crucial factors affecting TSLA's market performance.

How does Tesla, Inc. (TSLA) Stack Up Against its Peers?
Other stocks in the Auto & Vehicle Manufacturers sector that may be worth considering are Mercedes-Benz Group AG (MBGAF), REV Group, Inc. (REVG), and Suzuki Motor Corporation (SZKMY) - they have better POWR Ratings. Click here to explore more Auto & Vehicle Manufacturers stocks.
What To Do Next?
43 year investment veteran, Steve Reitmeister, has just released his 2024 market outlook along with trading plan and top 11 picks for the year ahead.
TSLA shares were trading at $244.84 per share on Wednesday morning, up $6.12 (+2.56%). Year-to-date, TSLA has gained 98.77%, versus a 20.89% rise in the benchmark S&P 500 index during the same period.
About the Author: Anushka Dutta

Anushka is an analyst whose interest in understanding the impact of broader economic changes on financial markets motivated her to pursue a career in investment research.
The post Is Tesla (TSLA) an Auto Stock Opportunity in December? appeared first on StockNews.com
