
Stocks were floating around in a well-defined trading range coming into the September 20th Fed announcement. Unfortunately, the increased clarity on what they mean by “higher rates for longer” has the market heading to new lows.
This has rattled the cage of some investors evoking questions like:
Is the bull market already over?
How low do we go before stocks bounce again?
We will answer all that and more in this week’s Reitmeister Total Return commentary.
Market Commentary
4,600 on the S&P 500 (SPY) was always too high for this market. Especially true when it was unclear when the Fed would be done tapping the brakes of the economy. Thus, it made sense for investors to take some money off the table in early August leading to a natural pullback.
Next up the Fed made it clearer what “higher rates for longer” meant at their 9/20 press conference. This included the September release of their Summary of Economic Projections which included insight that Fed officials now expect rates to be around 5.1% at the end of 2024...much higher than the previously stated level.
This has led to a massive Risk Off adjustment as it does marginally increase the odds of recession (and bear market). But more succinctly it means that bonds and interest bearing securities have become more attractive relative to stocks thanks to higher yields. Or to put it another way:
Rates Up > Stocks Down
Now let’s pull back to the big picture. Even after this realignment of funds, investors have to appreciate that the risk of recession is still very low. The Fed is simply choosing a path of lightly tapping on the brakes over a longer period of time to increase the odds of soft landing.
This is a better plan than violently slamming on the brakes with MUCH higher rates in the short run which increases the probability of an economic wreck in the long run.
This all shows up loud and clear in how they adjusted their economic forecast for 2024 higher to +1.5% GDP growth. Not stellar when 2.7% is the long term average. However, it sure is better than the 1.1% they previously projected.
Now let’s consider some other GDP indicators.
Goldman Sachs is staying put at 15% odds of recession in the coming year. Note that economists are told to start at 10% probability no matter how glorious the economy looks. So this means their teams sees very little reason for concern.
Next we will check in with the famed GDPNow model from the Atlanta Fed. That is shockingly high at +4.9% for Q3. That is just based on 1 month of data so far and likely will come down a notch when the early October reports are released like ISM Manufacturing and Retail Sales.
Likely the GDPNow model will fall in line with the Blue Chip Economist panel that right now stands at +2.9% for Q3. Last quarter the panel forecast was much closer to the mark.
When you boil it down it is hard to see that the odds of recession are that high. And thus hard to become bearish...and thus hard to see stocks falling much further. Will discuss more about that in the next section...
Price Action & Trading Plan
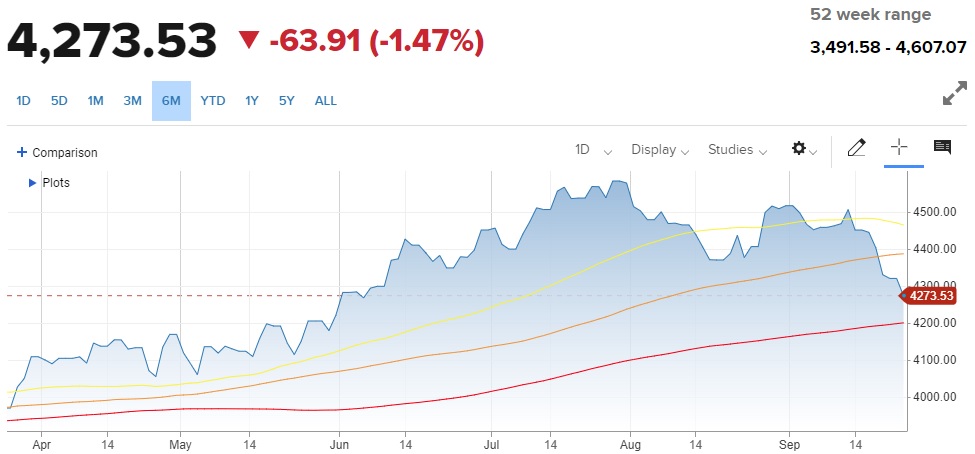
Moving Averages: 50 Day (yellow), 100 Day (orange), 200 Day (red)
We have been under the 100 day for a few sessions. So, it means that the 200 day moving average @ 4,195 is now in play (about 2% below Thursday’s close).
I didn’t think that was probable a week ago. But the Fed’s updated forecast means that the highly anticipated lowering of rates, and reacceleration for the economy, are a bit further down the road.
It doesn’t end the bull market story. Rather it just delays when it will really show up in improved earnings growth, which is the prime catalyst for higher share prices.
So yes, the odds of testing the 200 day moving average has increased. That is a healthy correction for the overall market after being near 4,600 back in July.
That correction will shake out the complacency that got built up during the overextend 5 month rally from March til August. This creates a healthy reset for stocks bringing them down to a better valuation point that will have investors more readily hitting the buy button once again. My guess is that will be at the 200 day moving average or slightly above.
This new information on the Fed also has me taking back my previous prediction of 4,850 for year end S&P 500 level. That is asking too much from the market at this time.
Rather, I think a touch of Santa Claus rally, plus increased clarity from the Fed at their next 2 meetings, will give investors the confidence to bid stocks back up to 4,500 to 4,600 by year end. And then be primed to make new highs above 5,000 next year.
The key to superior returns is determining the best stocks & ETFs to put into our portfolios to stay a step ahead of the pack. And that is what you will find in the next section...
What To Do Next?
Discover my current portfolio of 7 stocks packed to the brim with the outperforming benefits found in our POWR Ratings model.
Plus I have added 4 ETFs that are all in sectors well positioned to outpace the market in the weeks and months ahead.
This is all based on my 43 years of investing experience seeing bull markets...bear markets...and everything between.
If you are curious to learn more, and want to see these 11 hand selected trades, then please click the link below to get started now.
Steve Reitmeister’s Trading Plan & Top Picks >
Wishing you a world of investment success!

Steve Reitmeister…but everyone calls me Reity (pronounced “Righty”)
CEO, StockNews.com and Editor, Reitmeister Total Return
SPY shares were unchanged in after-hours trading Tuesday. Year-to-date, SPY has gained 12.60%, versus a % rise in the benchmark S&P 500 index during the same period.
About the Author: Steve Reitmeister

Steve is better known to the StockNews audience as “Reity”. Not only is he the CEO of the firm, but he also shares his 40 years of investment experience in the Reitmeister Total Return portfolio. Learn more about Reity’s background, along with links to his most recent articles and stock picks.
The post How Low Will Stocks Go? appeared first on StockNews.com
