
In an update, pharmaceutical multinational Merck & Co., Inc. (MRK) projected an upward revision in its annual sales forecast- a range of $59.7 billion to $60.2 billion as compared to the earlier estimate of $58.6 billion to $59.6 billion. Concurrently, the company also anticipates an adjusted profit in the region of $1.33 to $1.38 per share.
Street analysts predict a 4.7% year-over-year revenue increase to $14.48 billion for MRK for the fourth quarter ended December 2023. The company's surprise record has been commendable, having surpassed both consensus revenue and EPS estimates consistently over the trailing four quarters.
MRK’s earnings in the last reported quarter exceeded expectations, attributed mainly to robust sales of Keytruda, its flagship cancer drug, the HPV vaccine Gardasil, and its COVID-19 therapeutic Lagevrio. Lagevrio's performance is particularly noteworthy, given that sales of COVID-19 products from rivals have declined with the gradual retreat from the pandemic and reduced reliance on vaccines and treatments.
Merck pulled in $15.96 billion in revenue for the quarter, a 7% hike from the same period a year ago, culminating in a net income of $4.75 billion, or $1.86 per share. This outperforms the same period last year when the company recorded $3.25 billion net income, equivalent to $1.28 per share.
With continuous investment in the development of new formulations across its divisions and significant global presence, Merck's steady growth trajectory amid sustained healthcare demand is promising. Ergo, acquiring shares in this pharmaceutical behemoth, particularly before the impending earnings release, is worth consideration. A closer look at some of its fundamental performance indicators may be insightful.
Analyzing Merck & Co.'s Financial Performance: 2021-2023 Trends and Fluctuations
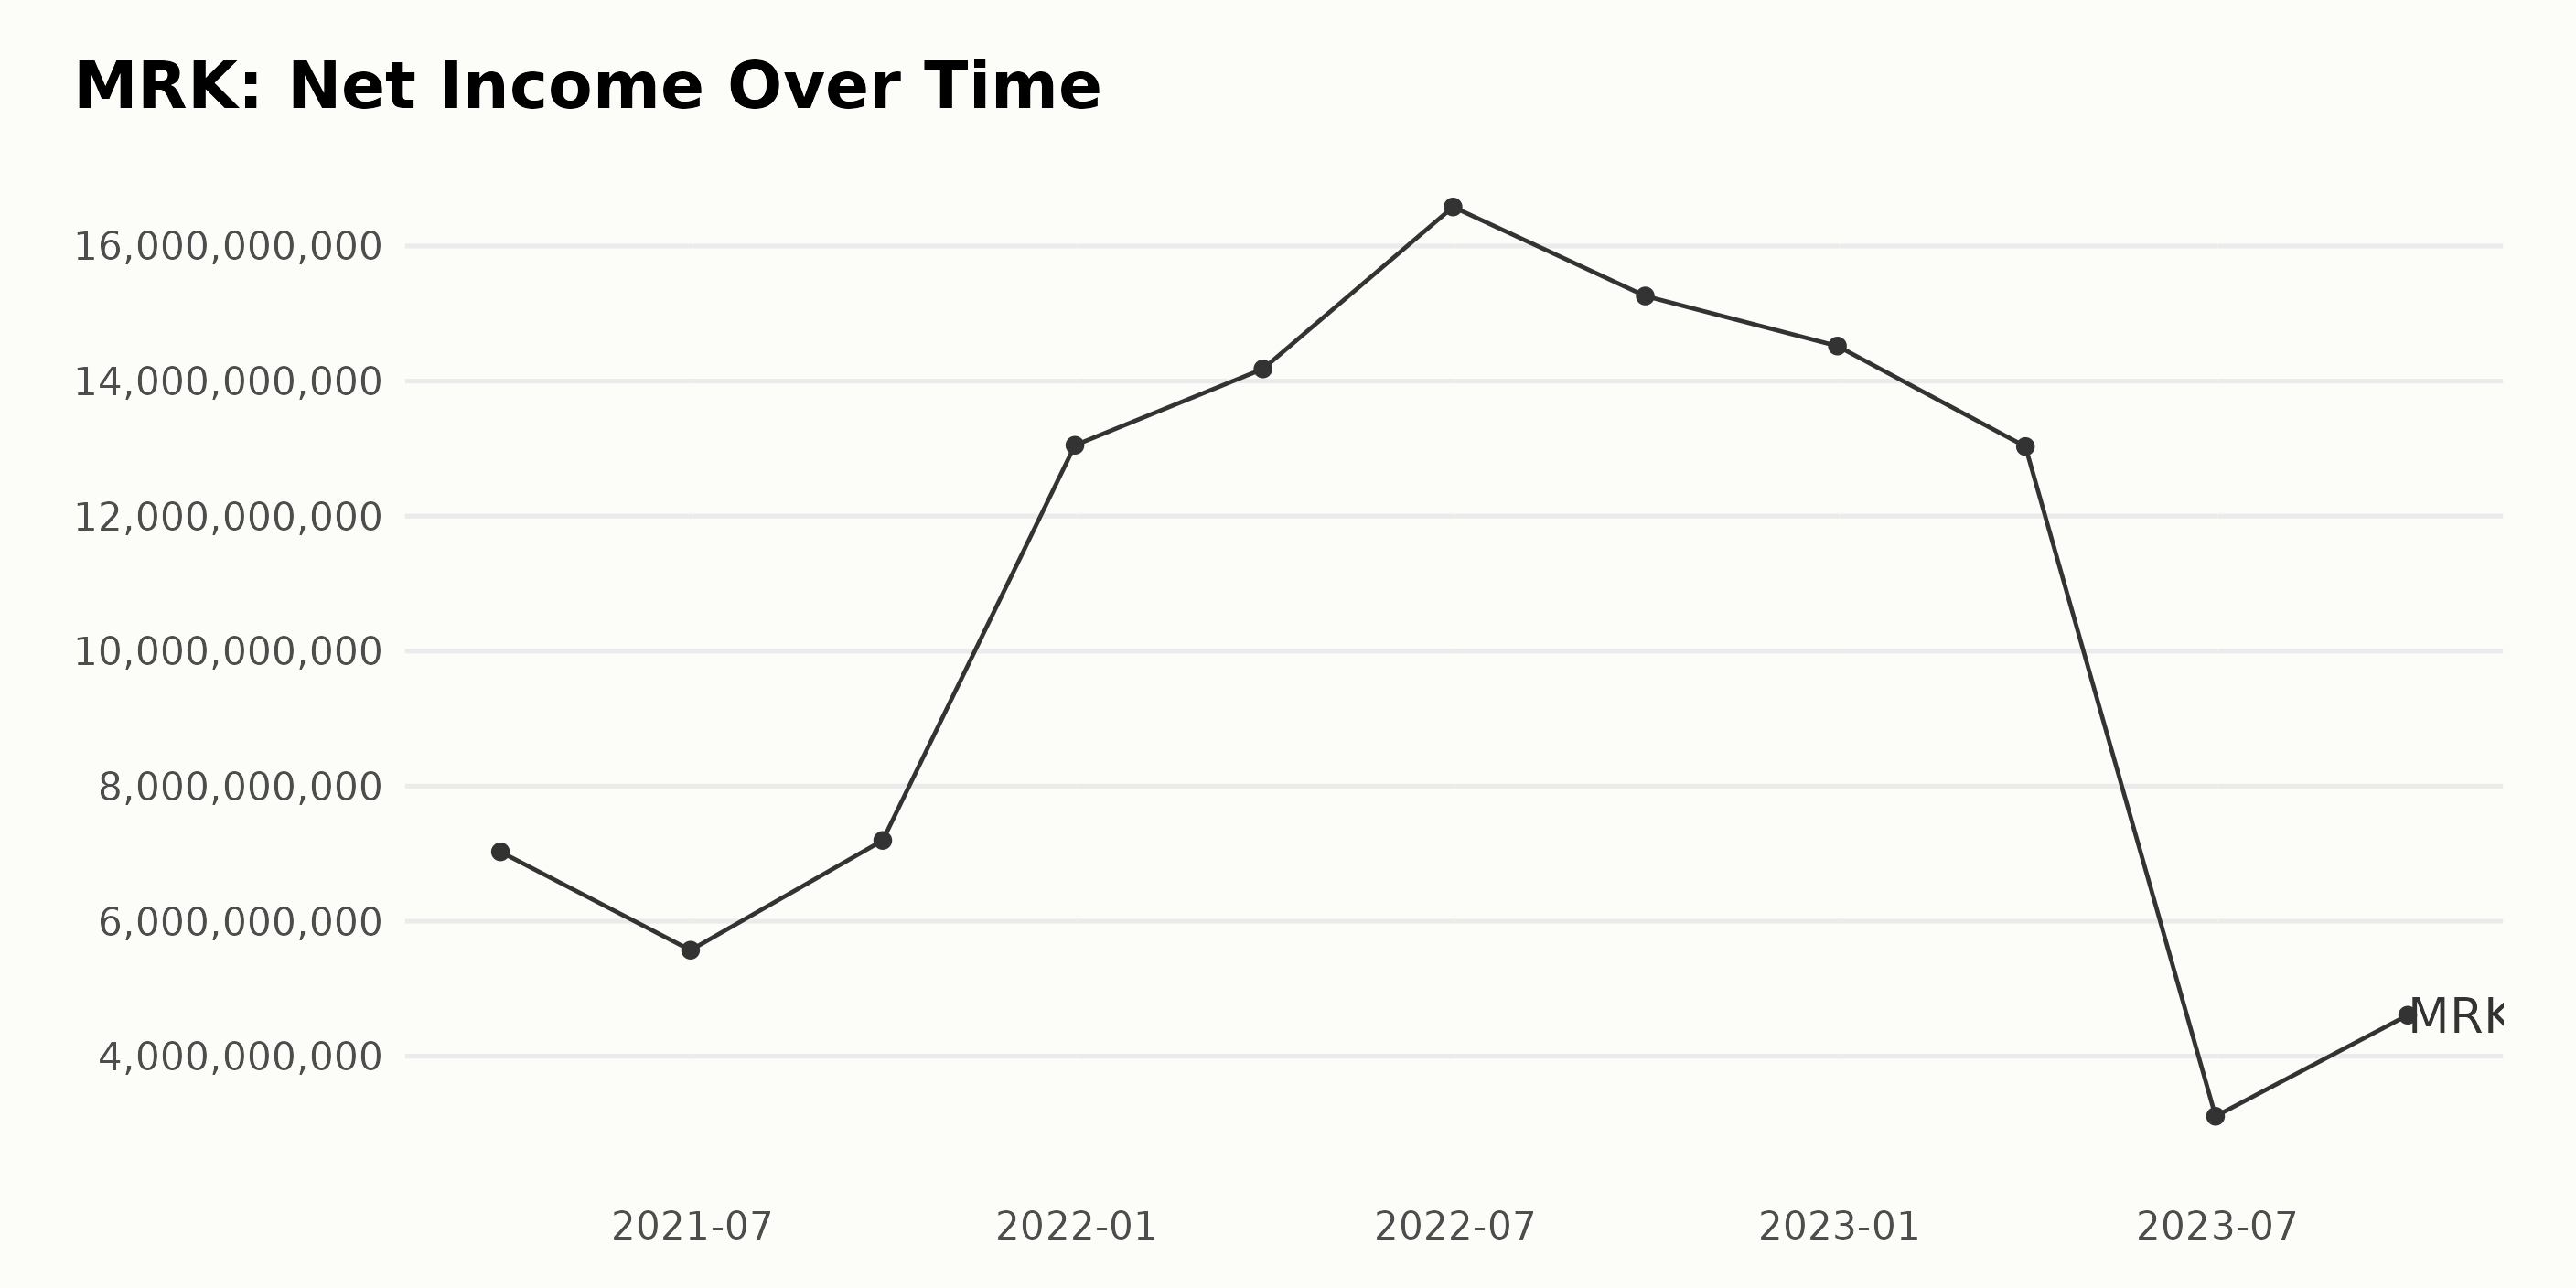
The following points detail the patterns observed in the trailing-12-month net income reported by Merck & Company Inc. (MRK):
- As of March 2021, the Net Income for MRK started at $7.03 billion.
- There was a slight drop in June 2021 when the Net Income reduced to $5.57 billion, but it bounced back in September of the same year; reaching $7.20 billion.
- Significant growth was seen at the end of 2021 when the Net Income nearly doubled to $13.05 billion in December from $7.20 billion in September.
- This growth trend continued into the first half of 2022, with the Net Income peaking at $16.58 billion in June, from $14.18 billion in March.
- However, there was a slight downturn in the second half of 2022, with Net Income decreasing to $15.26 billion in September before further reducing to $14.52 billion in December.
- Further reduction was observed in 2023, where Net Income fell noticeably to $13.03 billion in March and drastically reduced further to $3.11 billion by June.
- A positive uptick is noted towards the end of 2023, where Net Income rose to $4.61 billion by September.
Notably, the company experienced significant fluctuations in its net income during this period. There were periods of fast-paced growth, followed by substantial decreases, particularly in the June 2023 report.
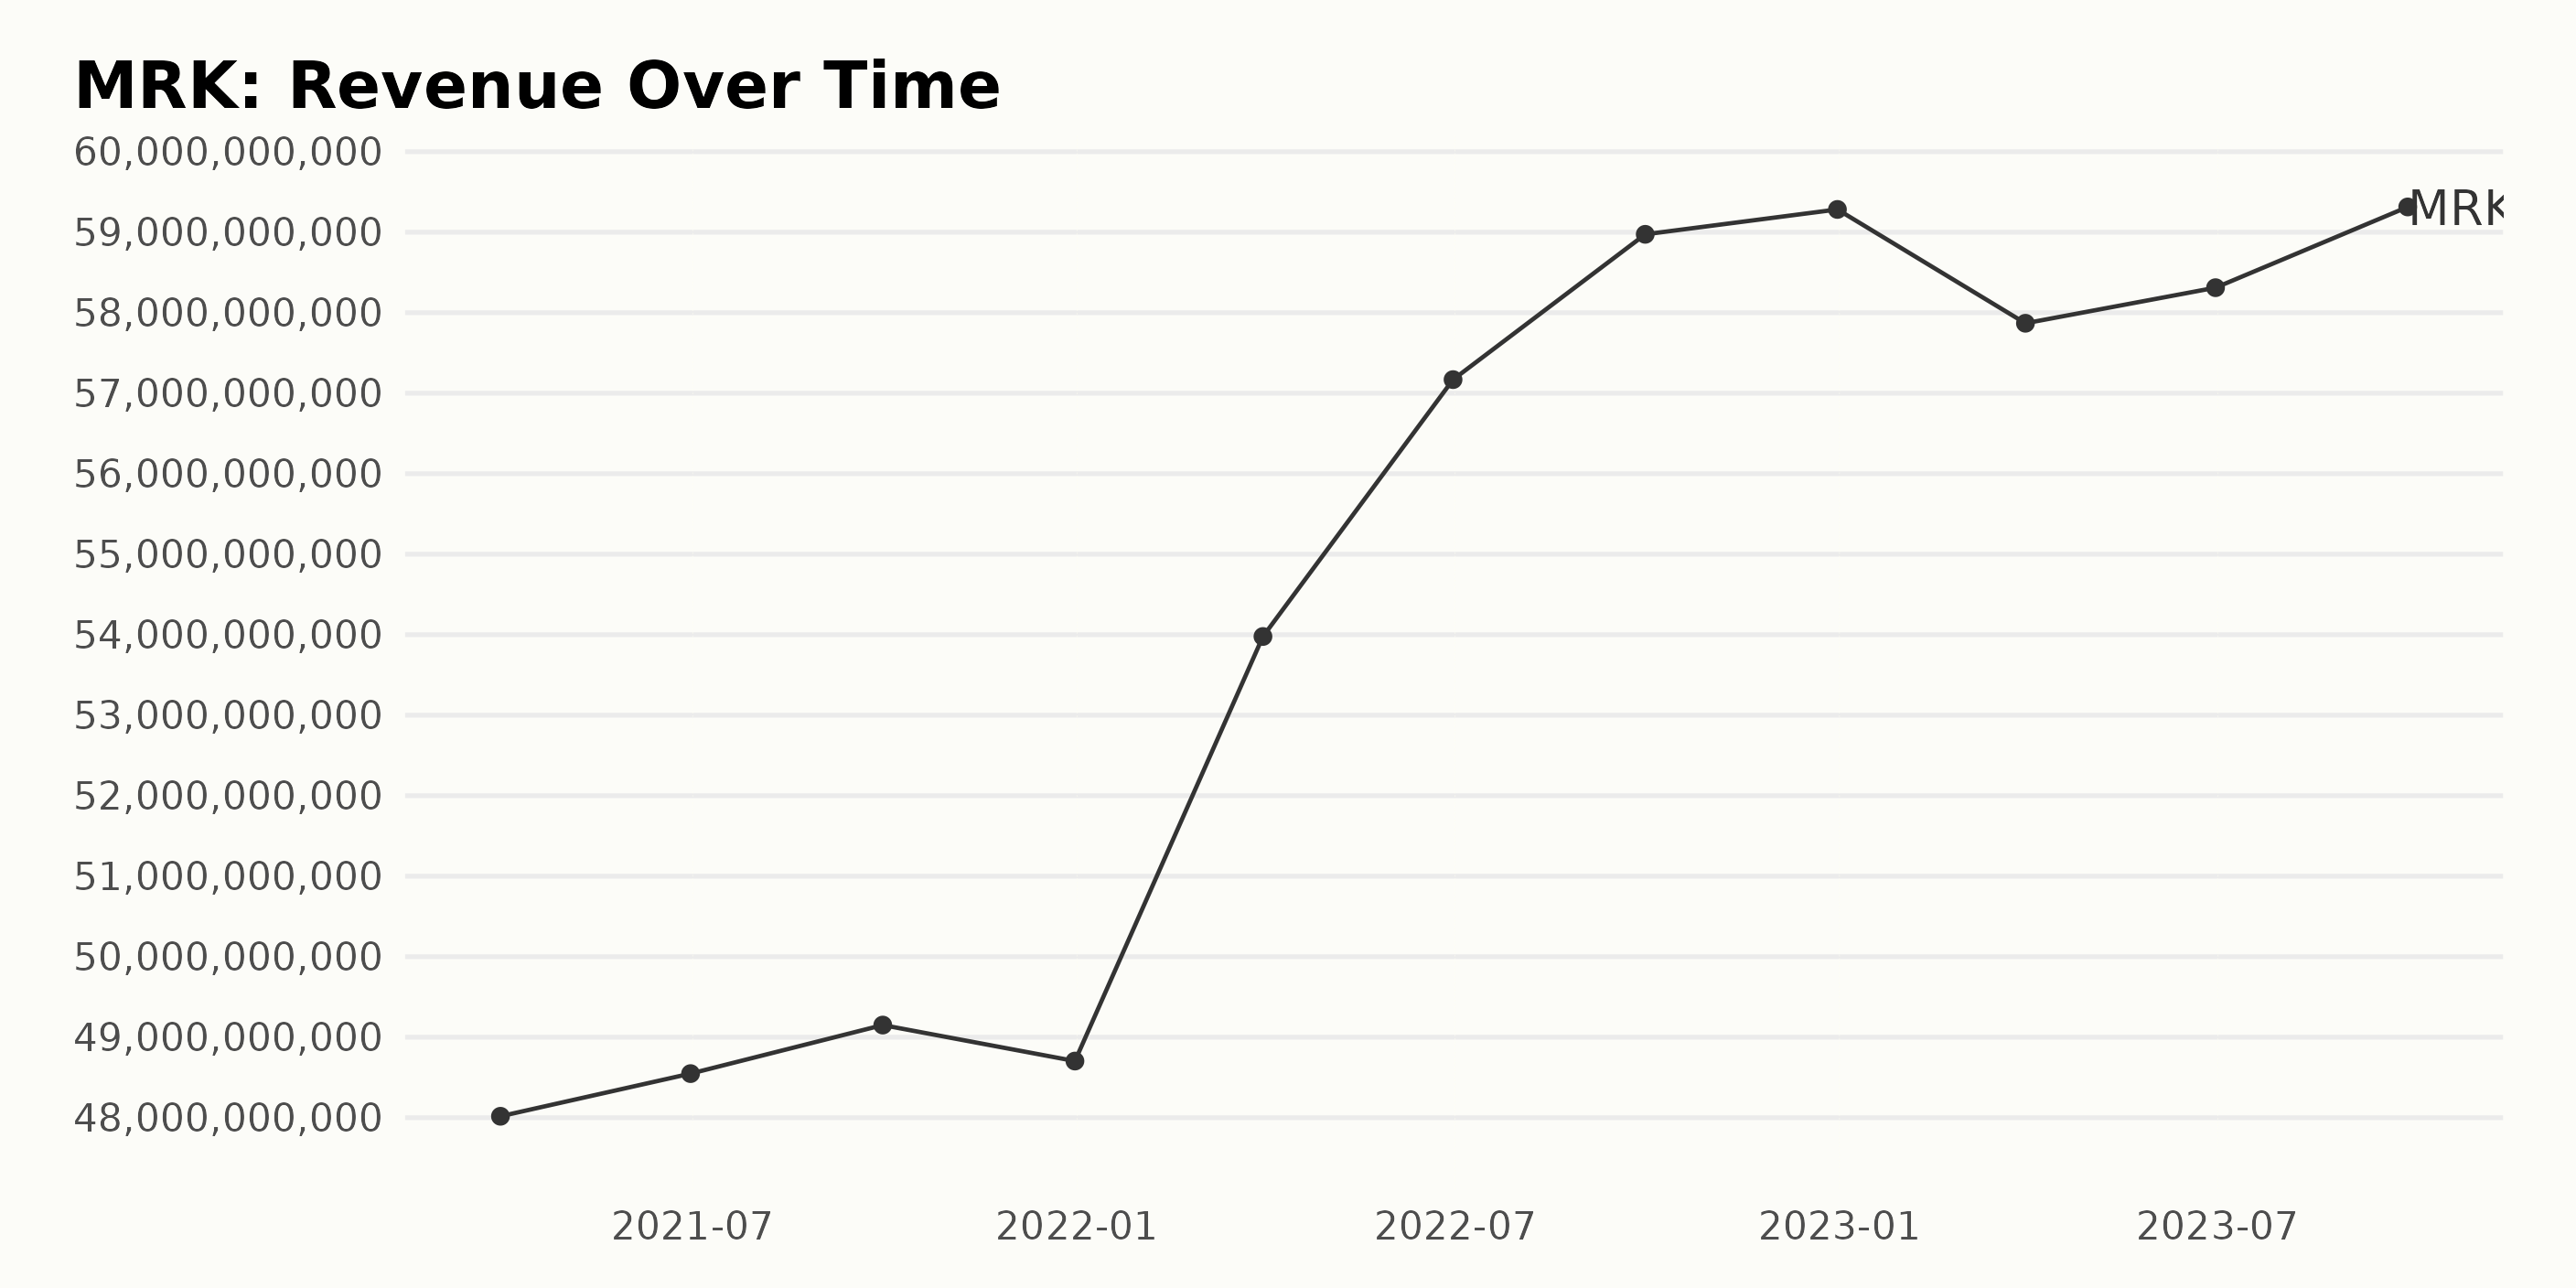
The trailing-12-month revenue trends for Merck & Company Inc. (MRK) demonstrate a general upward trajectory over the period of 2021 to 2023, with some noticeable fluctuations.
- Starting from $48.02 billion in March 2021, Revenue peaked at $59.28 billion in December 2022 before falling slightly.
- The most significant quarterly jump in income occurred between March 2022 ($53.98 billion) and June 2022 ($57.17 billion), a growth rate of approximately 6%.
- After a drop in revenue to $57.87 billion in March 2023, an ascending trend resumed, reaching $59.31 billion in September 2023. However, this was still below the peak figure of December 2022.
Overall, between March 2021 and September 2023, the company's revenue saw an increase of approximately 23%. Worth noting, this representation places emphasis on more recent data. The growth rate mentioned here is calculated from the first value to the last value.
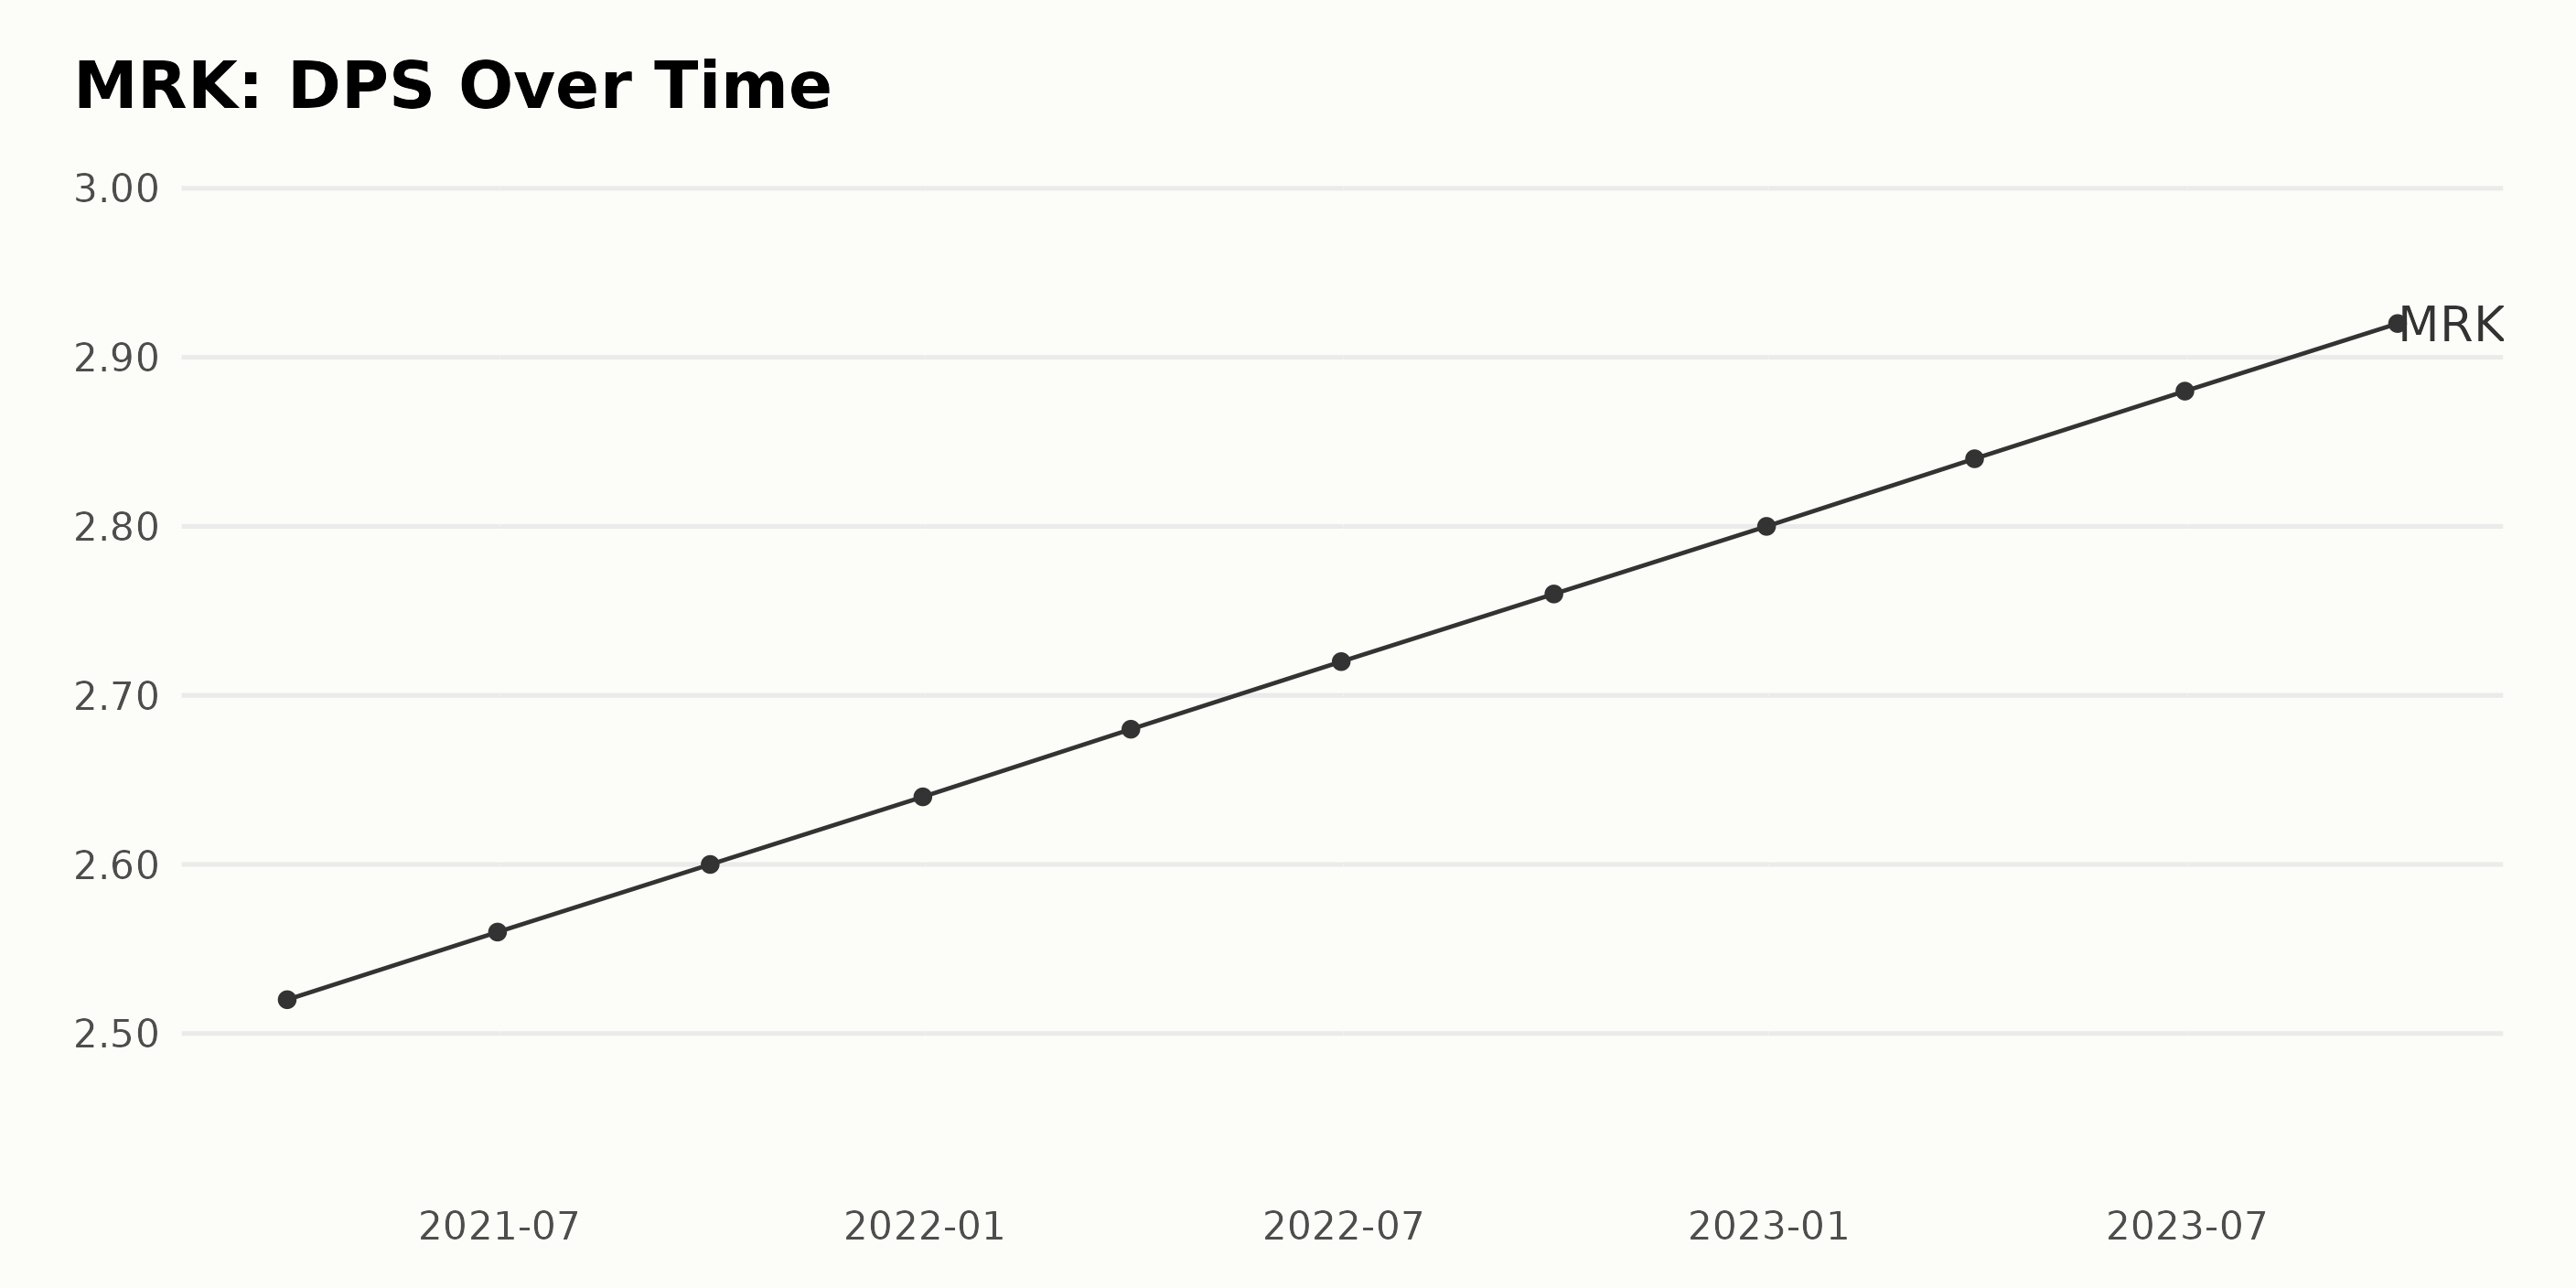
The DPS of Merck & Company Inc. (MRK) has been steadily increasing in the period from March 2021 to September 2023.
- In March 2021, MRK's DPS stood at $2.52.
- There was a slight increase to $2.56 by June 2021 and by the end of 2021, the DPS had risen to $2.64.
- A continuous upward trend continued into 2022, with the DPS reaching $2.68 in March, $2.72 in June, and $2.76 by September. As of the end of 2022, the DPS recorded was $2.8.
- The positive momentum persisted into the year 2023, with the DPS growing to $2.84 in March, $2.88 in June and a peak at $2.92 by September.
Overall, from March 2021 to September 2023, MRK's DPS exhibited an increasing trend, rising consistently from $2.52 to $2.92, a total increment of $0.4 over two and a half years, which corresponds to a growth rate of nearly 16%. The greatest emphasis in this analysis is placed on the most recent data, as the DPS value reached $2.92 in September 2023.
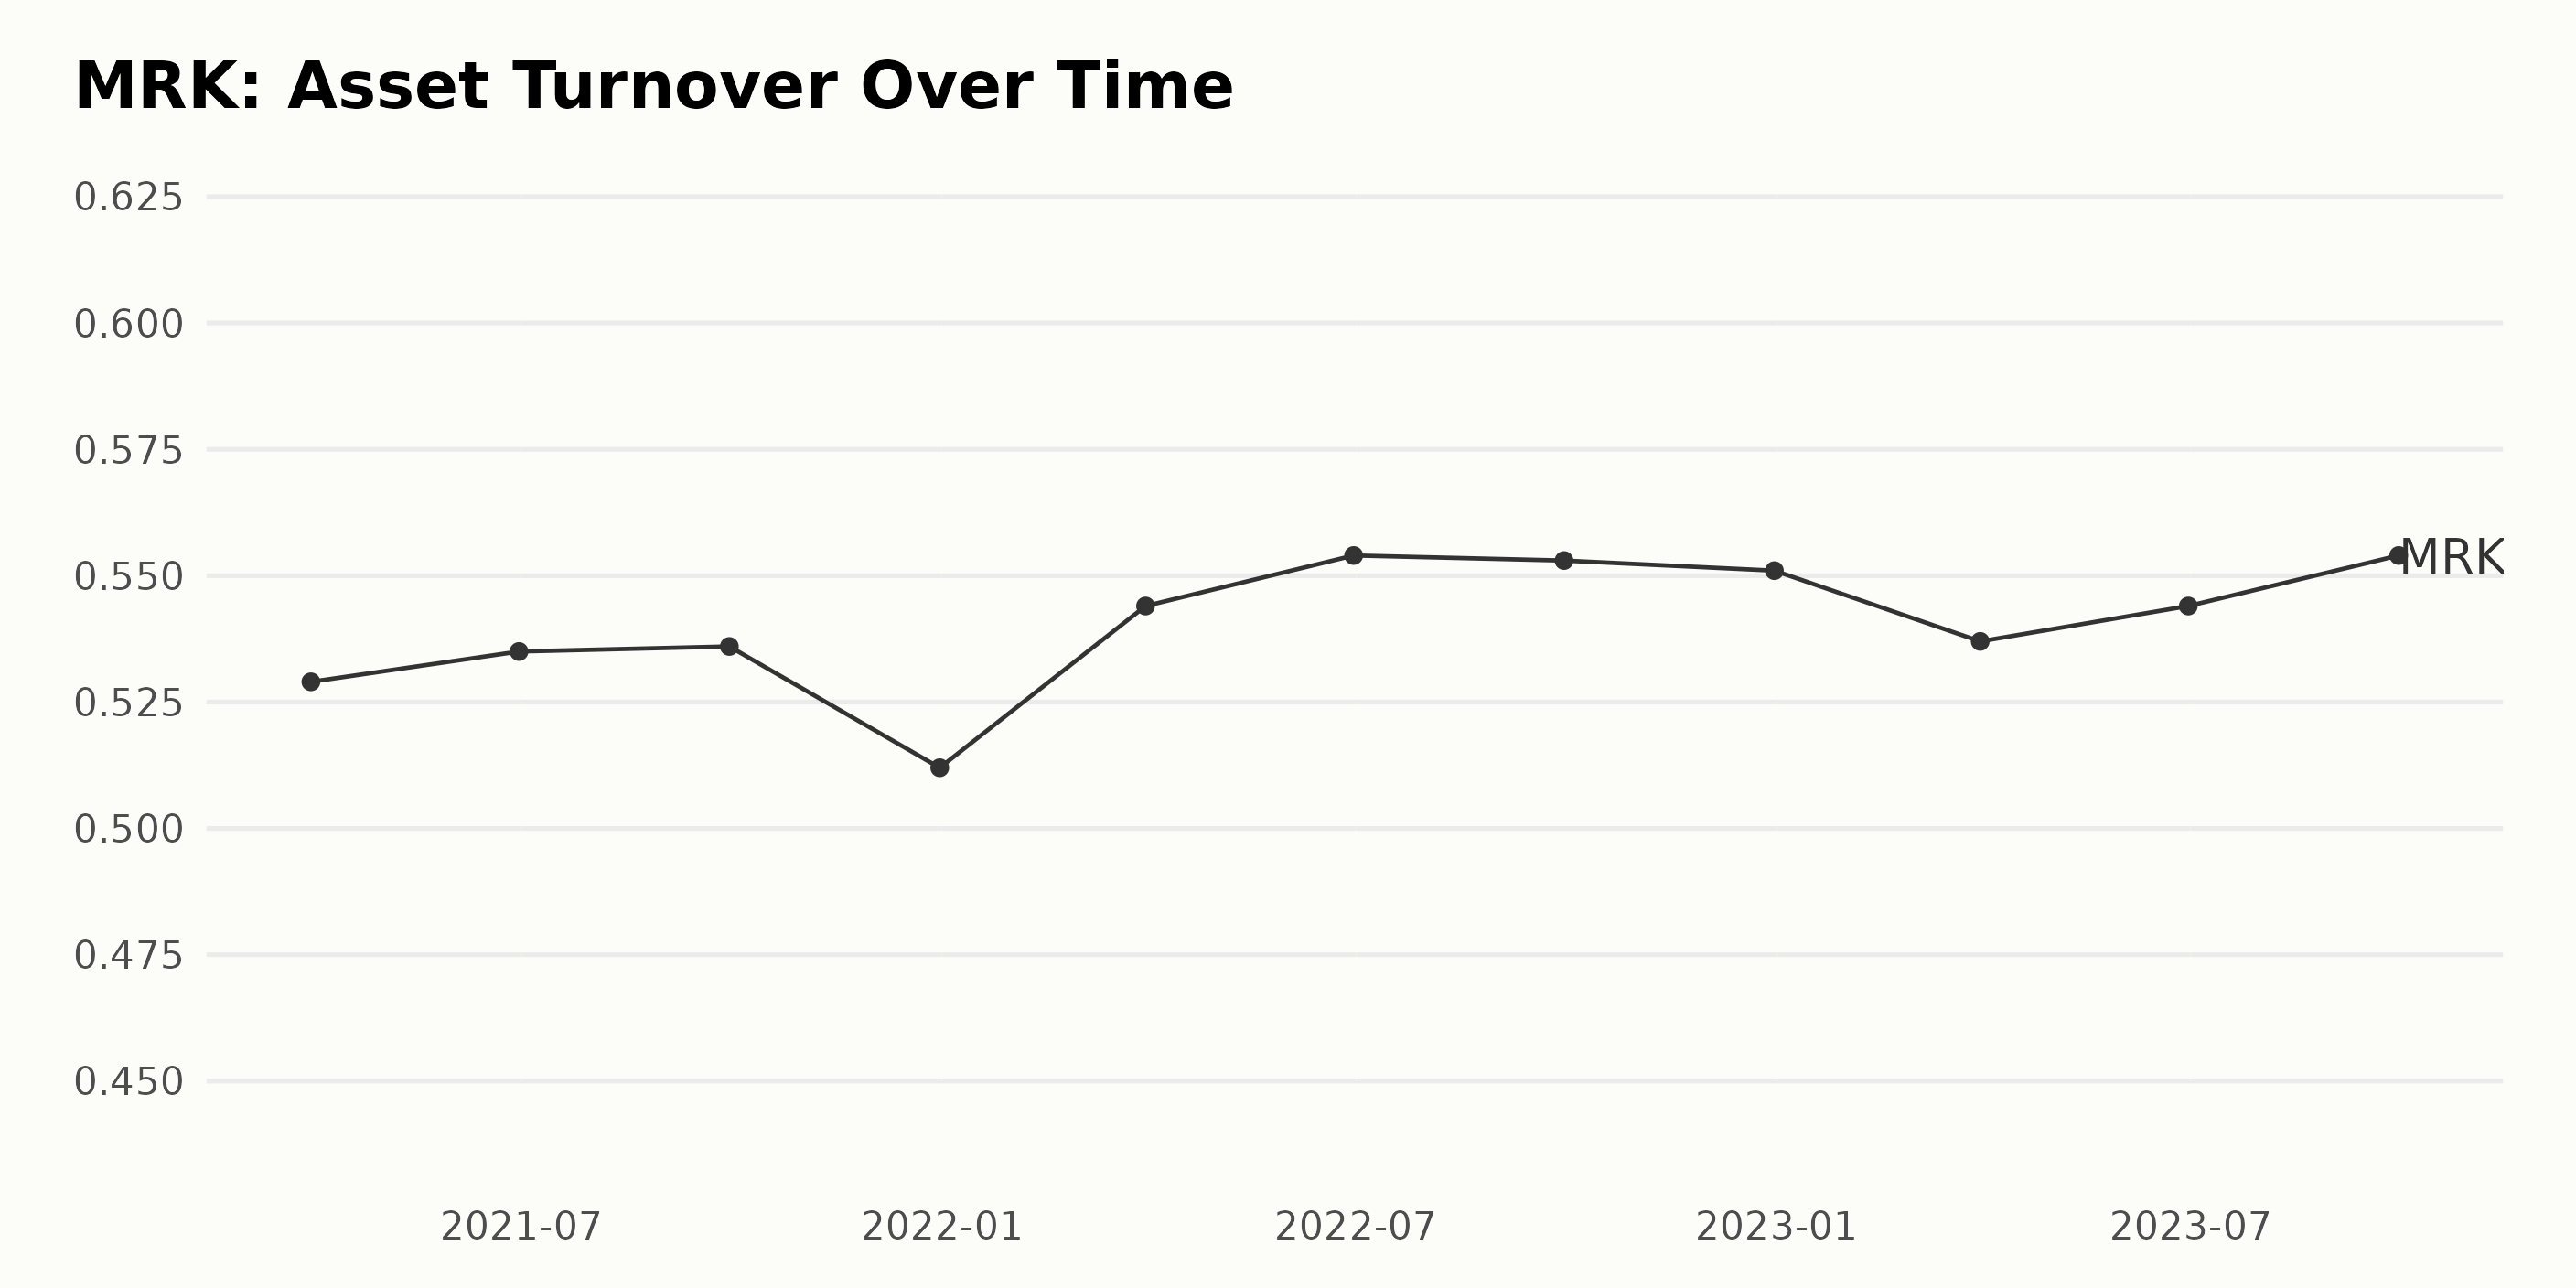
The series data represents the Asset Turnover trends of Merck & Company Inc. (MRK).
- Starting from March 31, 2021, the Asset Turnover was at 0.53.
- During the second and third quarter of the year 2021, a slight increase in asset turnover was observed, with the value going up to 0.54 respectively.
- By December 31, 2021, there was a minor drop in Asset Turnover to 0.51.
- In the first quarter of 2022, there was a significant increase in the asset turnover to 0.54 which continued to rise till June 30, 2022, reaching 0.55.
- Though the Asset Turnover dipped slightly by the end of 2022, it stayed relatively stable, dropping only to 0.55.
- Heading into 2023, there was a drop in the first quarter, bringing the value down to 0.54, however, the trends show that the Asset Turnover remained at 0.55 as of September 2023.
Looking at these changes, the overall trend shows a general increase in Asset turnover over the years with slight fluctuations each year. Comparing the first value to the last, there's a growth rate of approximately 4.52%. Greater attention is drawn to the more recent data from 2023, where despite minimal fluctuations, the value of Asset Turnover maintains an increasing trend. These figures reflect positively on MRK as they demonstrate efficient usage of its assets to generate sales.
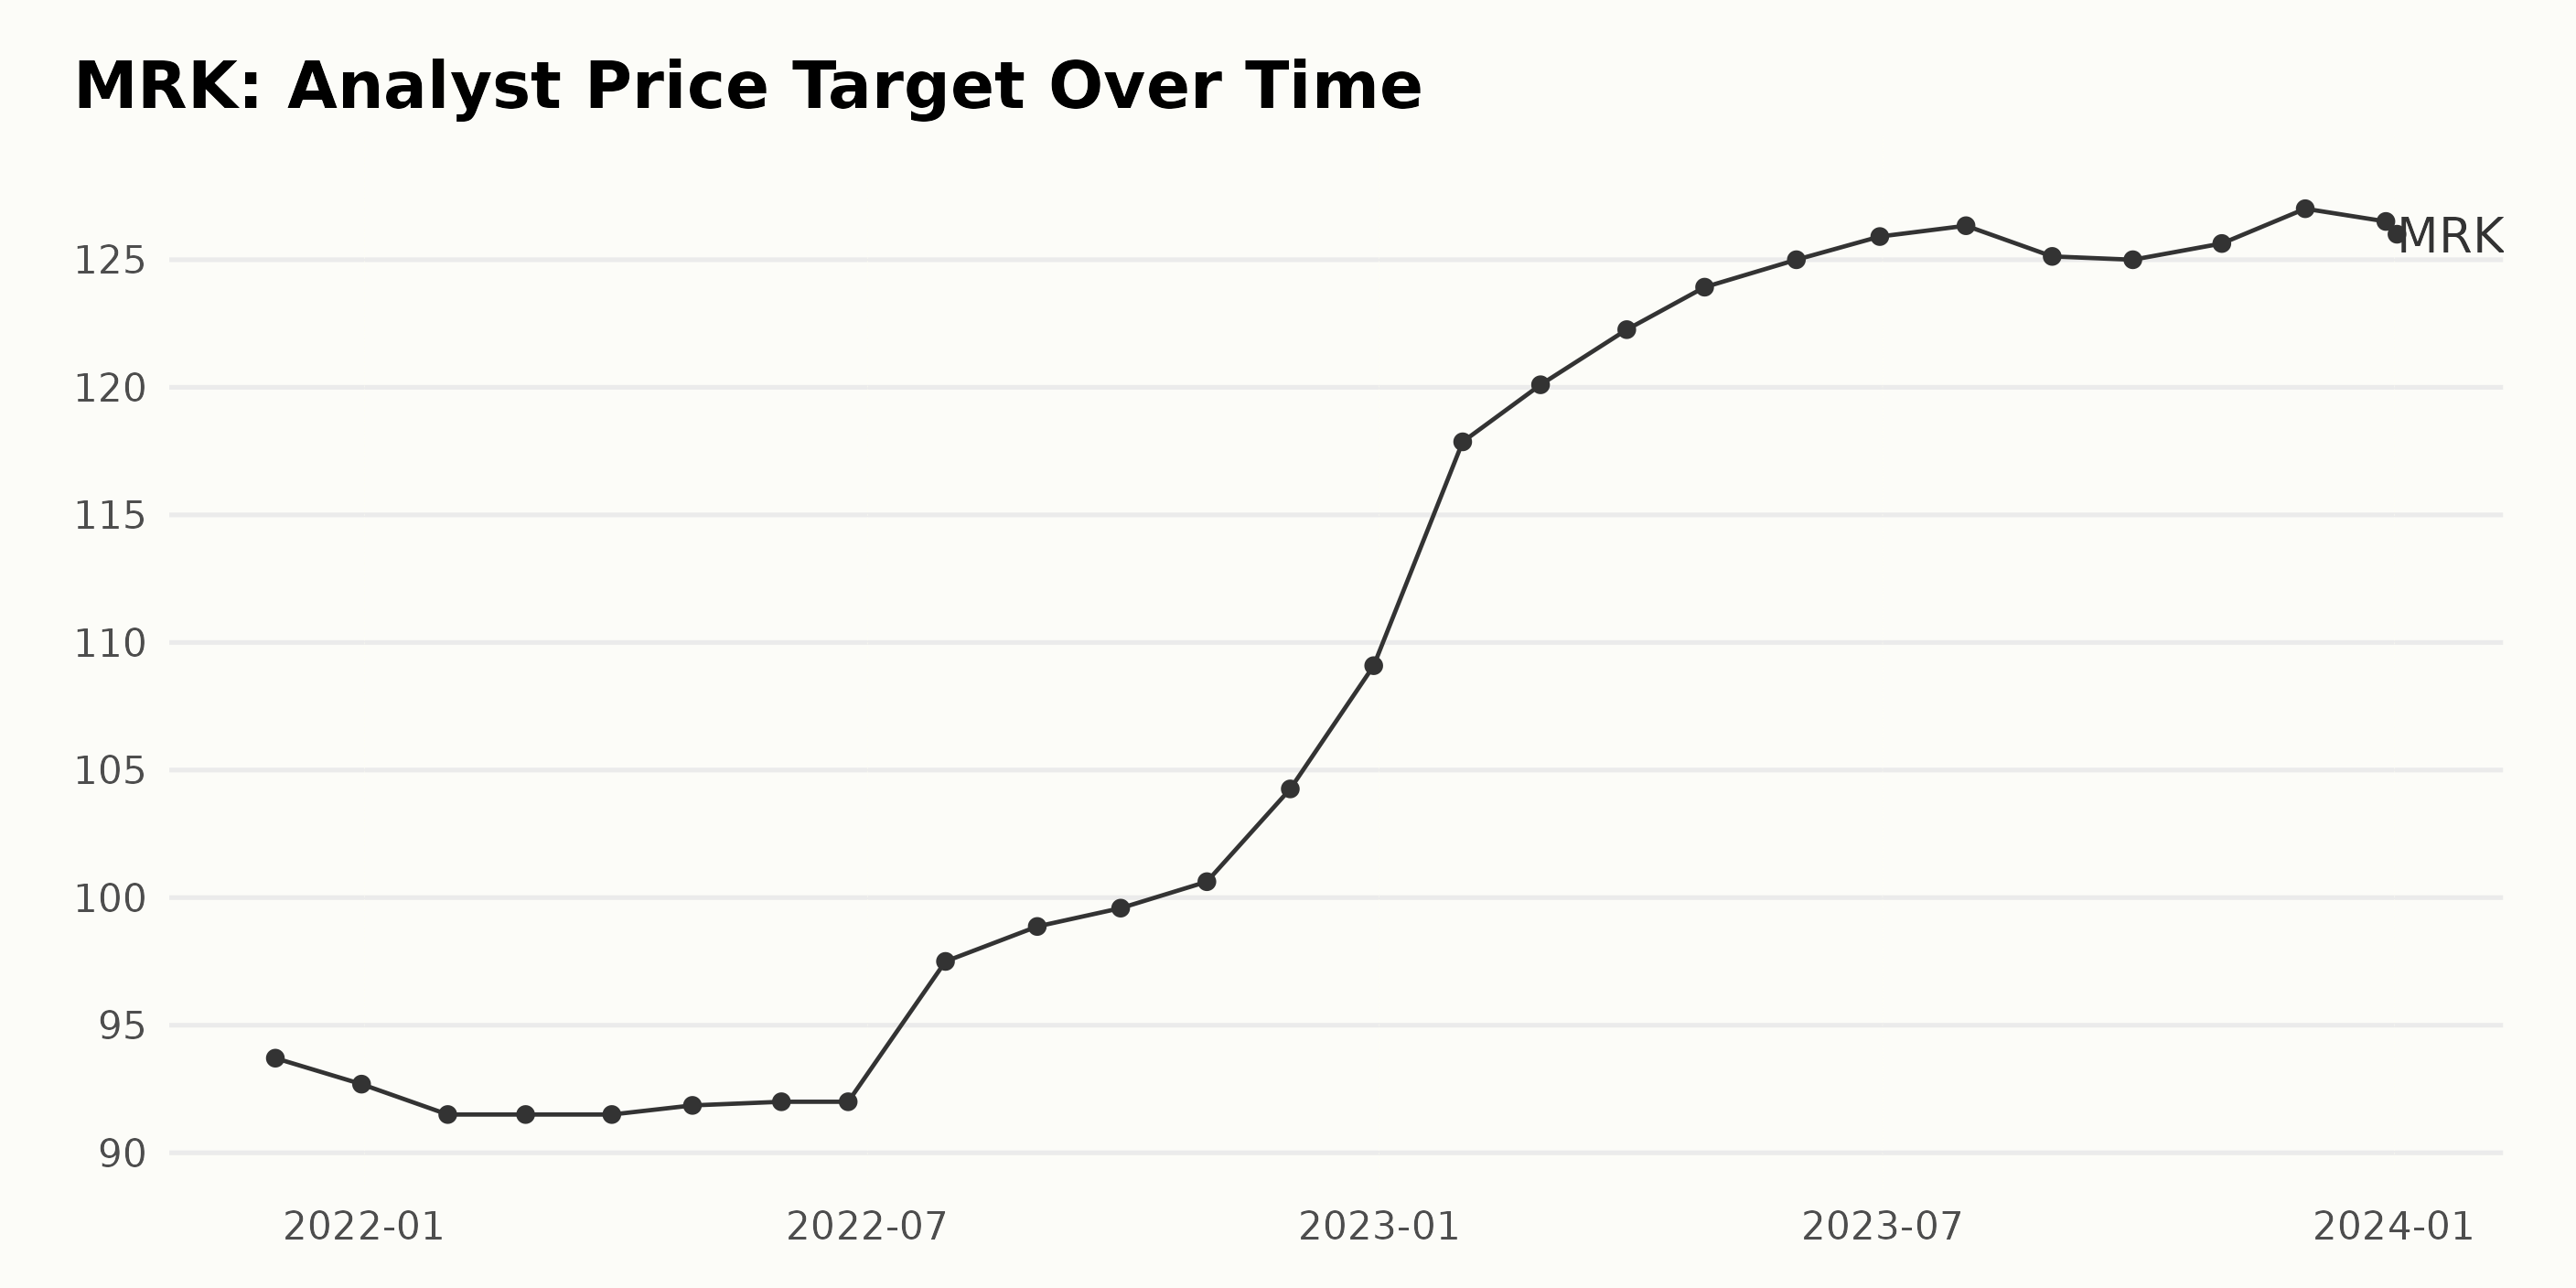
The data series depicts the trend and fluctuations in the Analyst Price Target (APT) for Merck & Company Inc. (MRK) spanning from November 2021 to January 2024. Initial Observations:
- In November 2021, the APT stood at $93.71
- Over the two months through end of January 2022, there was a minor decline to $91.50.
Main Trends:
- From February 2022, the APT value stagnated at $91.50 for a three-month period.
- From May 2022 to July 2022, a slight increase in APT was noticed, reaching $97.5 by the end of July 2022.
- Substantial growth occurred from July 2022 to January 2023, peaking at a value of $120.10.
Fluctuations:
- There were fluctuations with minor increases and decreases over the course of 2023.
- The APT hit its highest point at $127 in November 2023.
- However, by January 2024, it fell slightly to stand at $126.
The Growth Rate:
- The growth rate, from the first to last value (November 2021 to January 2024) was approximately 34%, increasing from $93.71 to $126.
In conclusion, the Analyst Price Target for MRK saw an overall upwards trend, despite periods of stagnation and minor fluctuations. The most significant increase was observed from mid-2022 through early 2023.
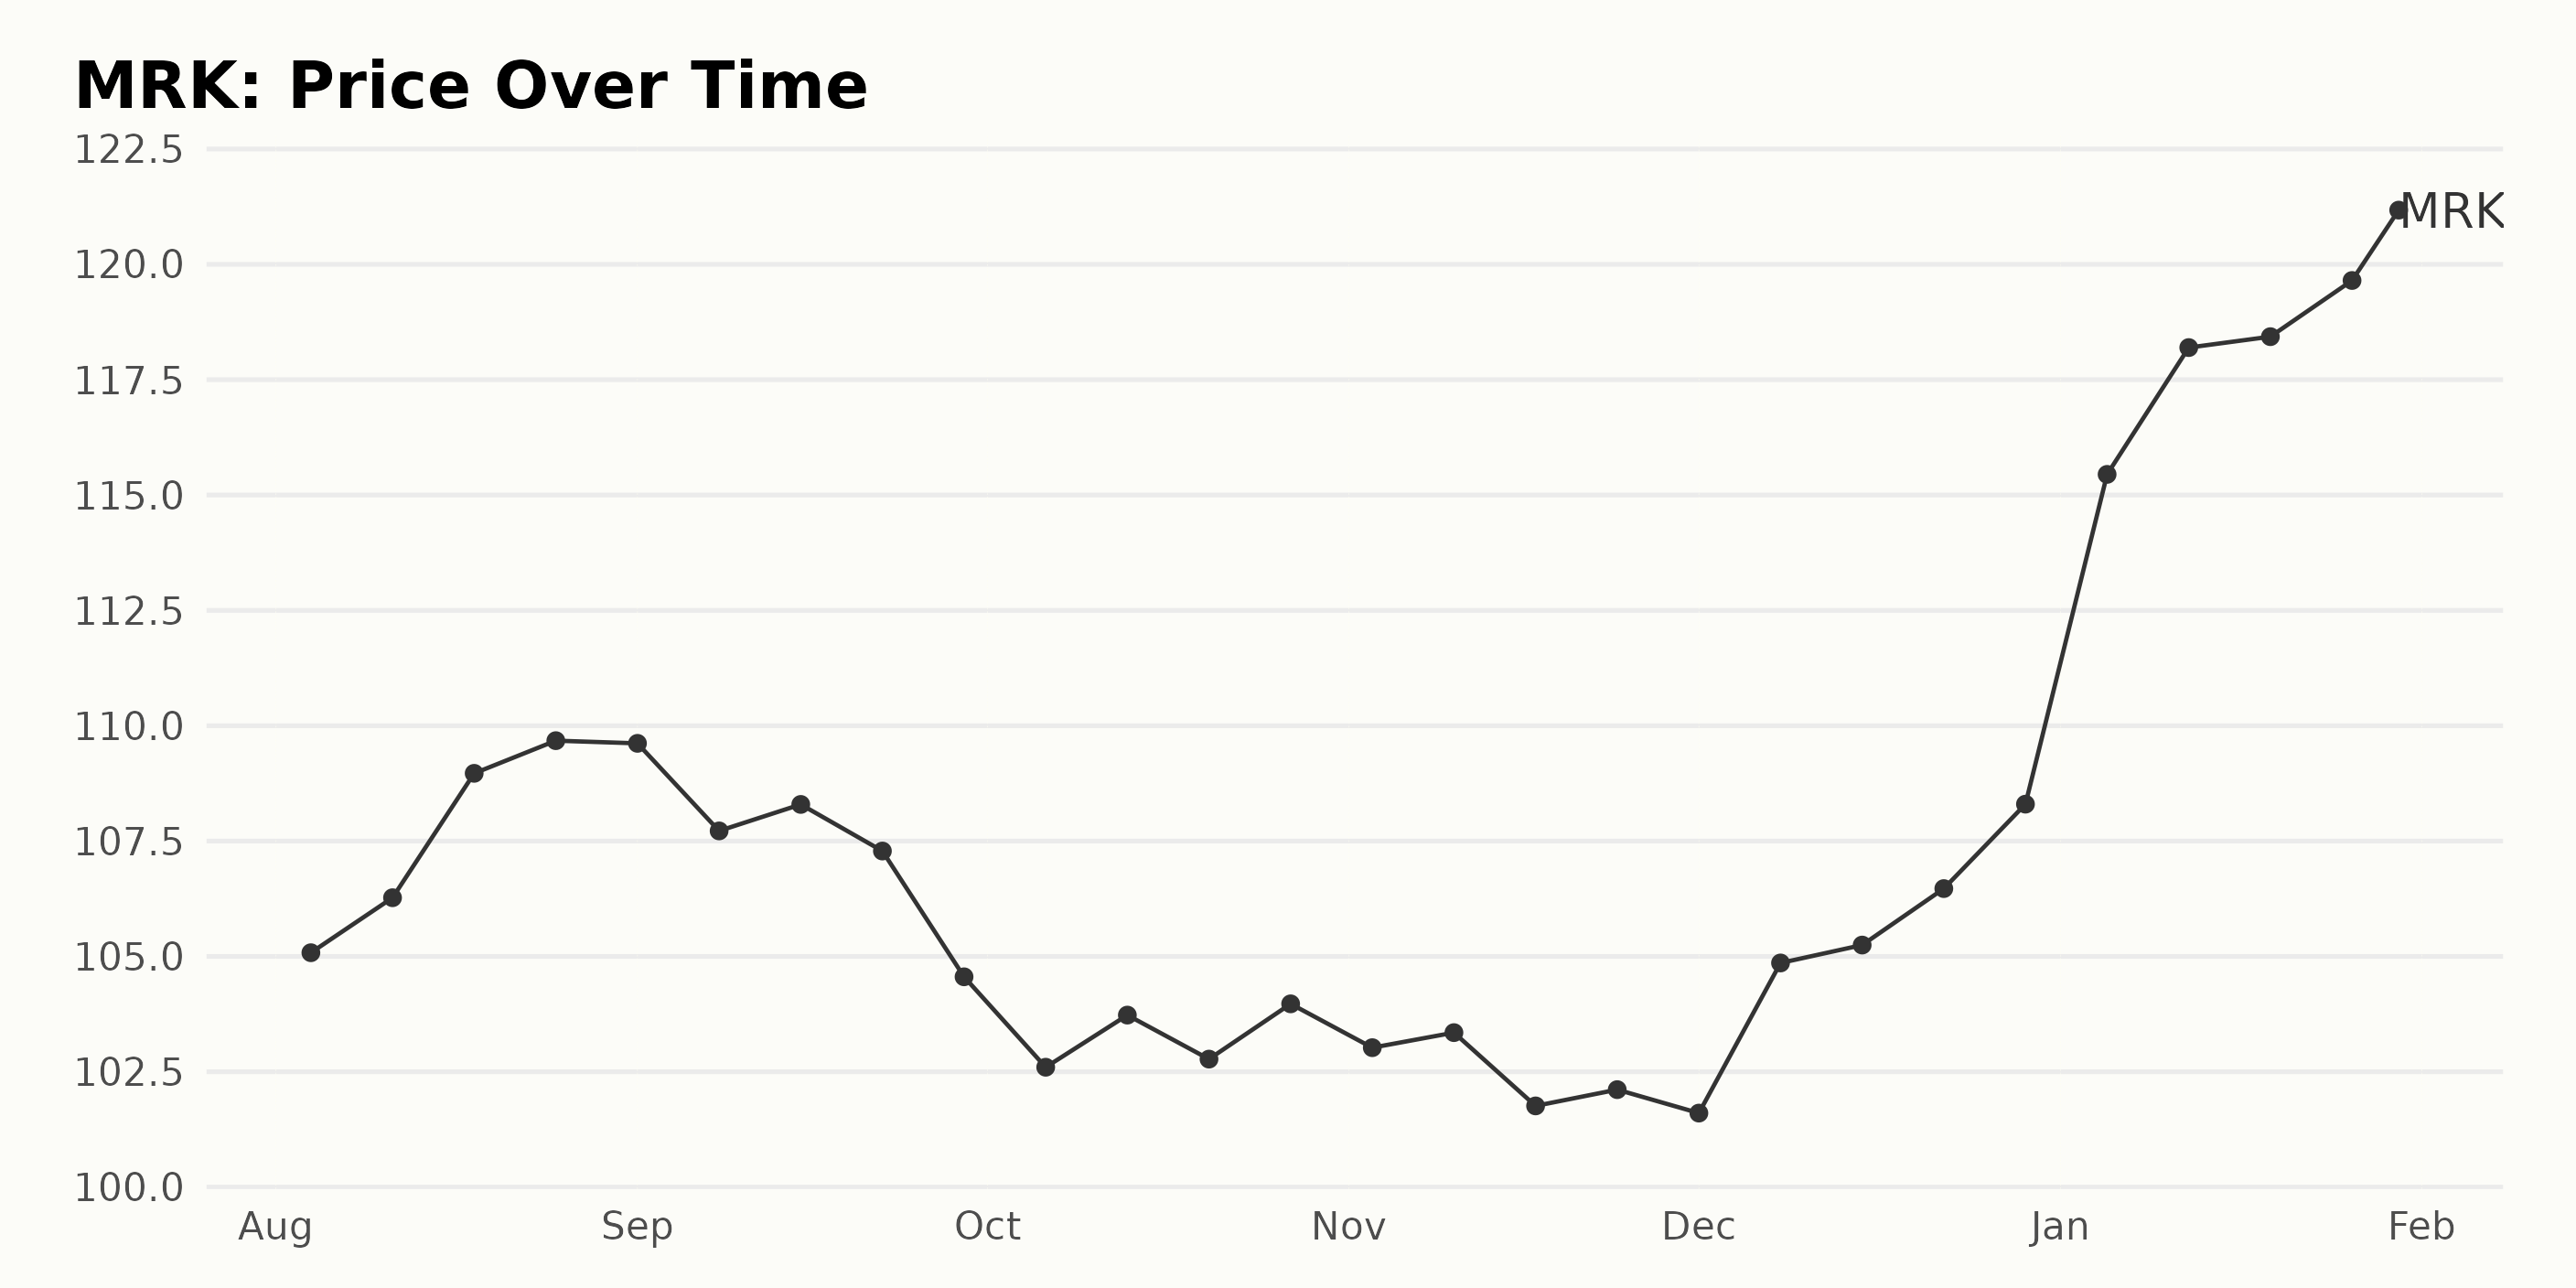
Analyzing Merck & Company's Share Price Fluctuations from August 2023 to January 2024
The data represents the historical share prices for MRK for the period between August 2023 and January 2024. The significant points are:
- On August 4, 2023, the share price starts at around $105.08.
- The share price shows continual growth through the month of August with a peak value of $109.68 on August 25, 2023.
- The price experienced a slight dip in early September 2023 reaching $107.72 on September 8, 2023, before rising again slightly and then experiencing a gradual decline throughout the rest of the month.
- The share price noticeably drops in October 2023, reaching a low of $102.60 on October 6, 2023, but it rises moderately again over the next few weeks.
- The price remains relatively stable around $103 in November 2023, with a small drop on November 17, 2023, to $101.76.
- A moderate increase in share price begins in December 2023, starting from $101.60 on December 1, 2023, and ending at $108.30 on December 29, 2023.
- In January 2024, the share price sees a significant leap, beginning at $115.45 on January 5, 2024, and ending at $121.18 on January 30, 2024.
From the given data, we can observe two major trends. In the initial period there are fluctuations but an overall downward trend in the share price. However, in the latter period, the price shows a clear accelerating upward trend. Here is a chart of MRK's price over the past 180 days.
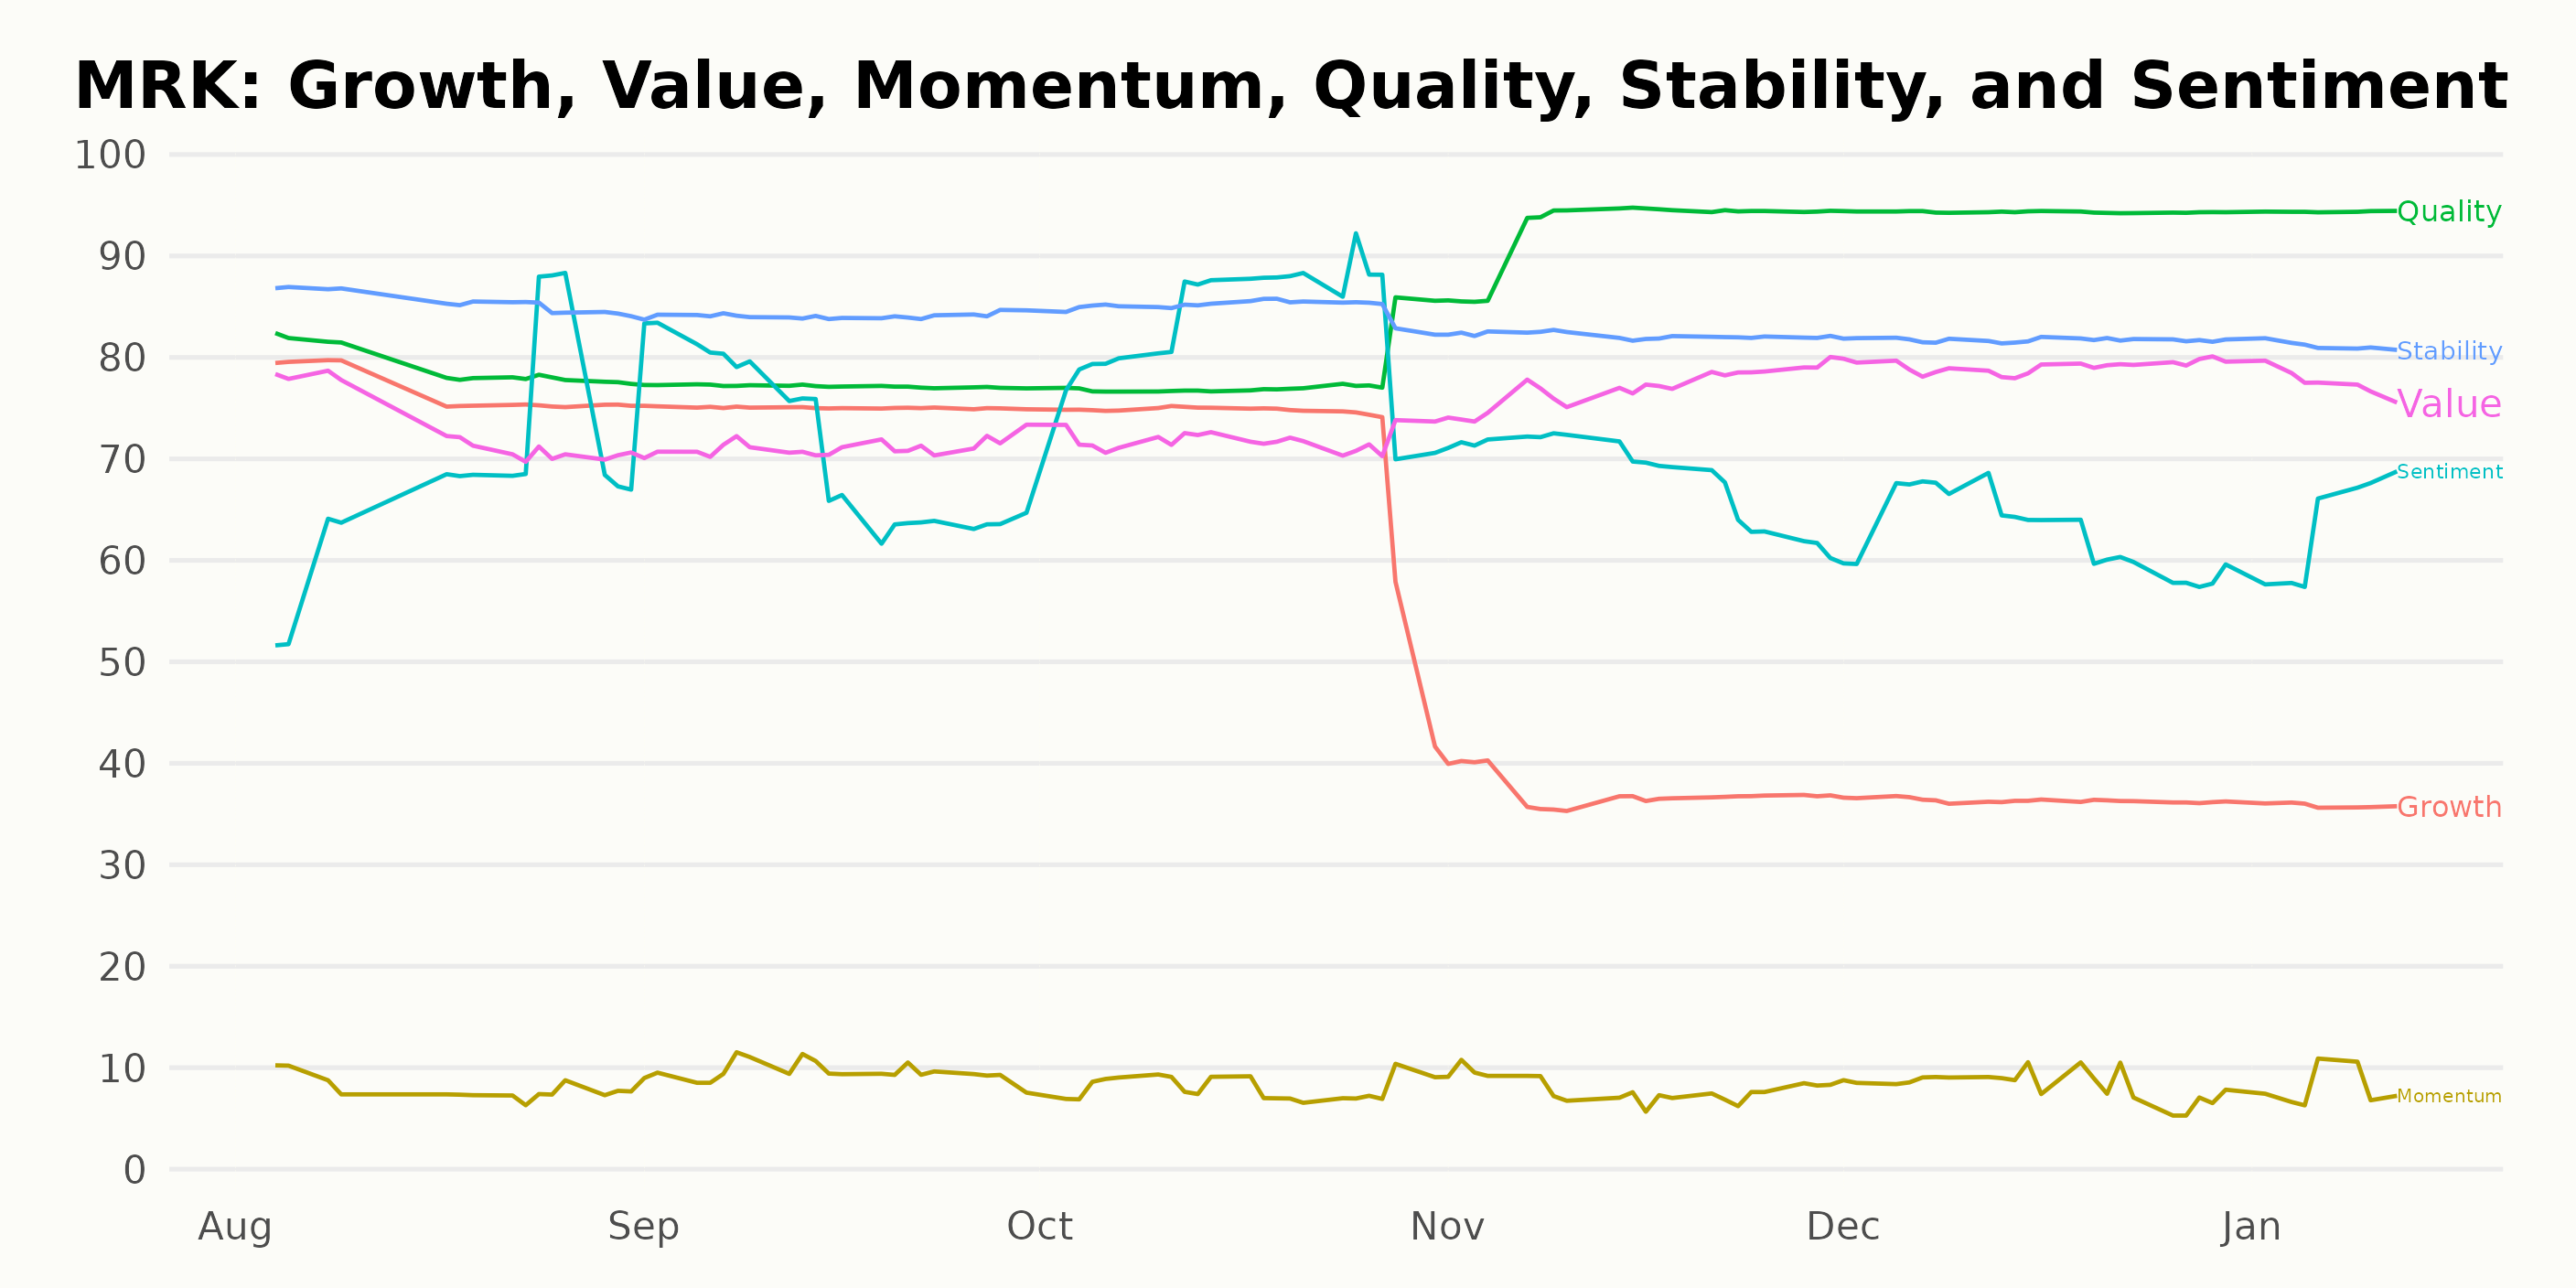
Tracking Merck & Co.'s Performance: Insights from Quality, Stability, and Growth Ratings
MRK has an overall B rating, translating to a Buy in our POWR Ratings system. It is ranked #18 out of the 162 stocks in the Medical - Pharmaceuticals category.
The three most notable POWR Ratings dimensions for Merck & Company Inc. (MRK) can be identified by considering their overall performance and clear trends over the observed period.
Quality: This dimension for MRK showed an upward trajectory over time, which is a positive indicator of the company's operational efficiency and financial health. From August to December 2023, the quality dimension saw continuous growth from 79 to 94.
Stability: Although the stability ratings dipped slightly over the considered period, MRK generally maintained high stability, making it one of the top dimensions. It started at 85 in August 2023 and finished at 81 in January 2024.
Growth: This dimension witnessed a considerable downward trend, from 76 in August 2023 to 36 in January 2024. As it clearly stands out, it is worth discussing despite the negative connotation. Specific noteworthy points:
- In August 2023, Quality started at 79 and gradually increased to 94 by January 2024.
- Stability, although decreased marginally from 85 in August 2023 to 81 in January 2024, retained consistently high ratings.
- The Growth parameter witnessed a significant decline, dropping from 76 in August 2023 to 36 in January 2024.
How does Merck & Company Inc. (MRK) Stack Up Against its Peers?
Other stocks in the Medical – Pharmaceuticals sector that may be worth considering are Novo Nordisk A/S (NVO), Novartis AG (NVS) and Taro Pharmaceutical Industries Ltd. (TARO) -- they have better POWR Ratings.
What To Do Next?
Get your hands on this special report with 3 low priced companies with tremendous upside potential even in today’s volatile markets:
3 Stocks to DOUBLE This Year >
MRK shares rose $0.34 (+0.28%) in premarket trading Wednesday. Year-to-date, MRK has gained 11.87%, versus a 2.90% rise in the benchmark S&P 500 index during the same period.
About the Author: Subhasree Kar

Subhasree’s keen interest in financial instruments led her to pursue a career as an investment analyst. After earning a Master’s degree in Economics, she gained knowledge of equity research and portfolio management at Finlatics.
The post Merck (MRK): Quarterly Earnings - What Investors Should Know appeared first on StockNews.com
