
The Trend Asset Allocation Model is an asset allocation model that applies trend-following principles based on the inputs of global stock and commodity prices. This model has a shorter time horizon and tends to turn over about 4-6 times a year. The performance and full details of a model portfolio based on the out-of-sample signals of the Trend Model can be found here.

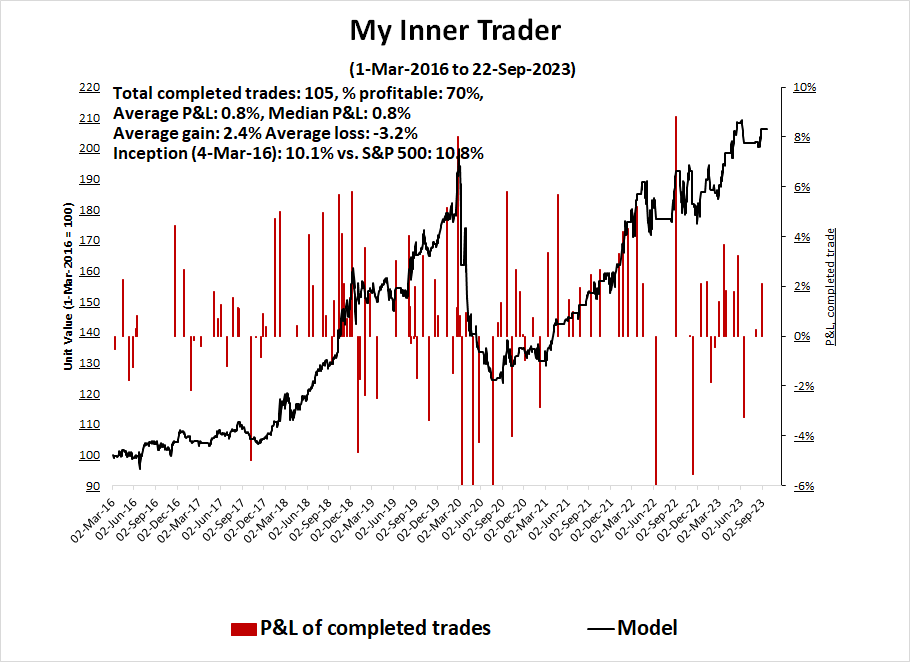
My inner trader uses a trading model, which is a blend of price momentum (is the Trend Model becoming more bullish, or bearish?) and overbought/oversold extremes (don't buy if the trend is overbought, and vice versa). Subscribers receive real-time alerts of model changes, and a hypothetical trading record of the email alerts is updated weekly here. The hypothetical trading record of the trading model of the real-time alerts that began in March 2016 is shown below.
The latest signals of each model are as follows:
- Ultimate market timing model: Buy equities (Last changed from “sell” on 28-Jul-2023)*
- Trend Model signal: Bullish (Last changed from “neutral” on 28-Jul-2023)*
- Trading model: Neutral (Last changed from “bearish” on 03-Aug-2023)*
Update schedule: I generally update model readings on my site on weekends. I am also on X/Twitter at @humblestudent. Subscribers receive real-time alerts of trading model changes, and a hypothetical trading record of those email alerts is shown here.
Subscribers can access the latest signal in real time here.
VIX as fear gaugeThere have been a series of recent articles highlighting the subdued level of the VIX Index and the seasonal tendency for equity volatility to spike this time of year (see this Barron’s article as an example). Other analysts have speculated that the VIX Index is failing as a fear gauge.
I have few opinions on the seasonality of the VIX, though last week has historically been a weak one for S&P 500 returns. However, I beg to differ on the use of the VIX as a fear gauge.
That’s because the VIX Index was not designed to be a fear indicator. It was designed to measure the implied volatility of a series of at-the-money options with a 1-month time horizon. While some analysts have seized upon implied volatility for use as a fear gauge, the index was never intended for use that way.
Indeed, the current explosion in 0DTE trading, or options that expire the same day, makes a 1-month implied volatility have less utility as a sentiment indicator. Arguably, VXST, or the 9-day VIX, is more useful to measure short-term sentiment. The accompanying chart shows that VXST was faster to spike in the current instance than VIX. The term structure of the VIX-VXST curve shows an inversion, which is an indication of fear appearing in the market.

The key question for investors is whether fear levels are high enough for a short-term bottom. The full post can be found here.

