
The Trend Asset Allocation Model is an asset allocation model that applies trend-following principles based on the inputs of global stock and commodity prices. This model has a shorter time horizon and tends to turn over about 4-6 times a year. The performance and full details of a model portfolio based on the out-of-sample signals of the Trend Model can be found here.

My inner trader uses a trading model, which is a blend of price momentum (is the Trend Model becoming more bullish, or bearish?) and overbought/oversold extremes (don't buy if the trend is overbought, and vice versa). Subscribers receive real-time alerts of model changes, and a hypothetical trading record of the email alerts is updated weekly here. The hypothetical trading record of the trading model of the real-time alerts that began in March 2016 is shown below.
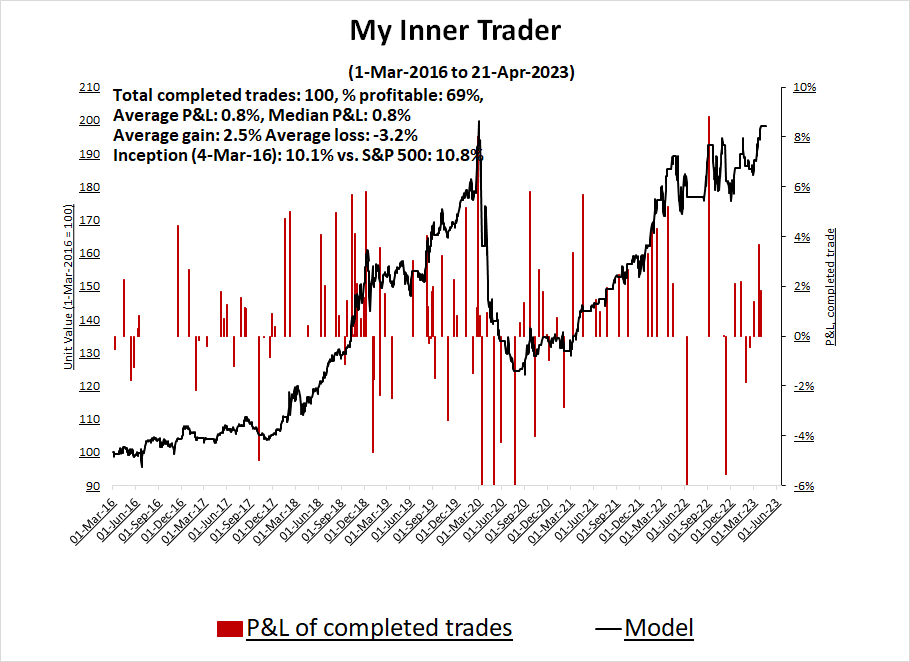 The latest signals of each model are as follows:
- Ultimate market timing model: Sell equities*
- Trend Model signal: Neutral*
- Trading model: Neutral*
Update schedule: I generally update model readings on my site on weekends. I am also on Twitter at @humblestudent and on Mastodon at @humblestudent@toot.community. Subscribers receive real-time alerts of trading model changes, and a hypothetical trading record of those email alerts is shown here.
Subscribers can access the latest signal in real time here. The Mona Lisa market
The Economist aptly characterized the current circumstances like the Mona Lisa:
What is the Mona Lisa doing? At first glance the subject of the world’s most famous painting seems to be smiling. Look again and her smile fades. When it next reappears, it is a different sort of smile. Leonardo da Vinci achieved this ambiguous effect with the use of sfumato, where he blurred the lines around Mona Lisa’s face. No matter how many times you look, you are unsure quite what is happening.
The post-pandemic economy is like the Mona Lisa. Each time you look, you see something different. After chaos in the banking industry, many analysts are now convinced that the world economy is heading for a “hard-landing” recession. Few seem to expect a “no-landing” scenario, in which the economy remains untroubled by rising interest rates—a fashionable opinion just weeks ago, and one which itself supplanted a common view late last year that a mild recession was certain.
Even though the stock market isn’t the economy, it’s also beset by a series of cross-currents that are difficult to interpret, much like the Mona Lisa. Starting with earnings season, which is in full swing. It began with a series of strong reports from large banks, but one key test came last week when about 50% of regional banks, which were at the epicentre of the latest banking crisis, reported. Equity bulls breathed a sigh of relief when the KBW Regional Banking Index held technical support.
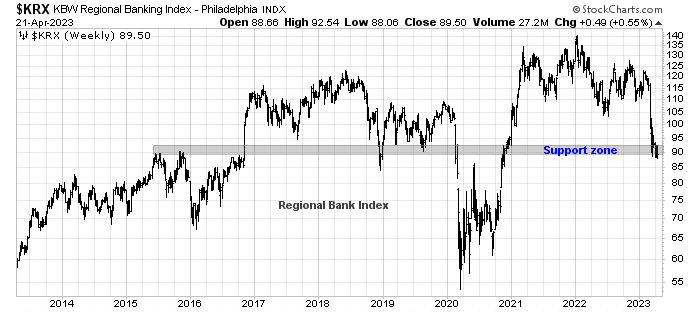 Even though the regional banks held support, the bulls face a series of obstacles to overcome, and it isn’t clear at all whether they’ll succeed.
The full post can be found here.

